Micro-segmentation
Micro-segmentation is part of Network Security, available exclusively with an Enterprise license. The required feature flag is microsegmentation.
The Micro-segmentation tab of Network Security turns the Proxmox VE firewall into a zone policy you can deploy safely. You group guests into zones, declare the flows allowed between them, watch the real traffic in observation, then block zone by zone once nothing unexpected remains. ProxCenter compiles the policy into native Proxmox firewall objects, so Proxmox keeps enforcing it even when ProxCenter is down.
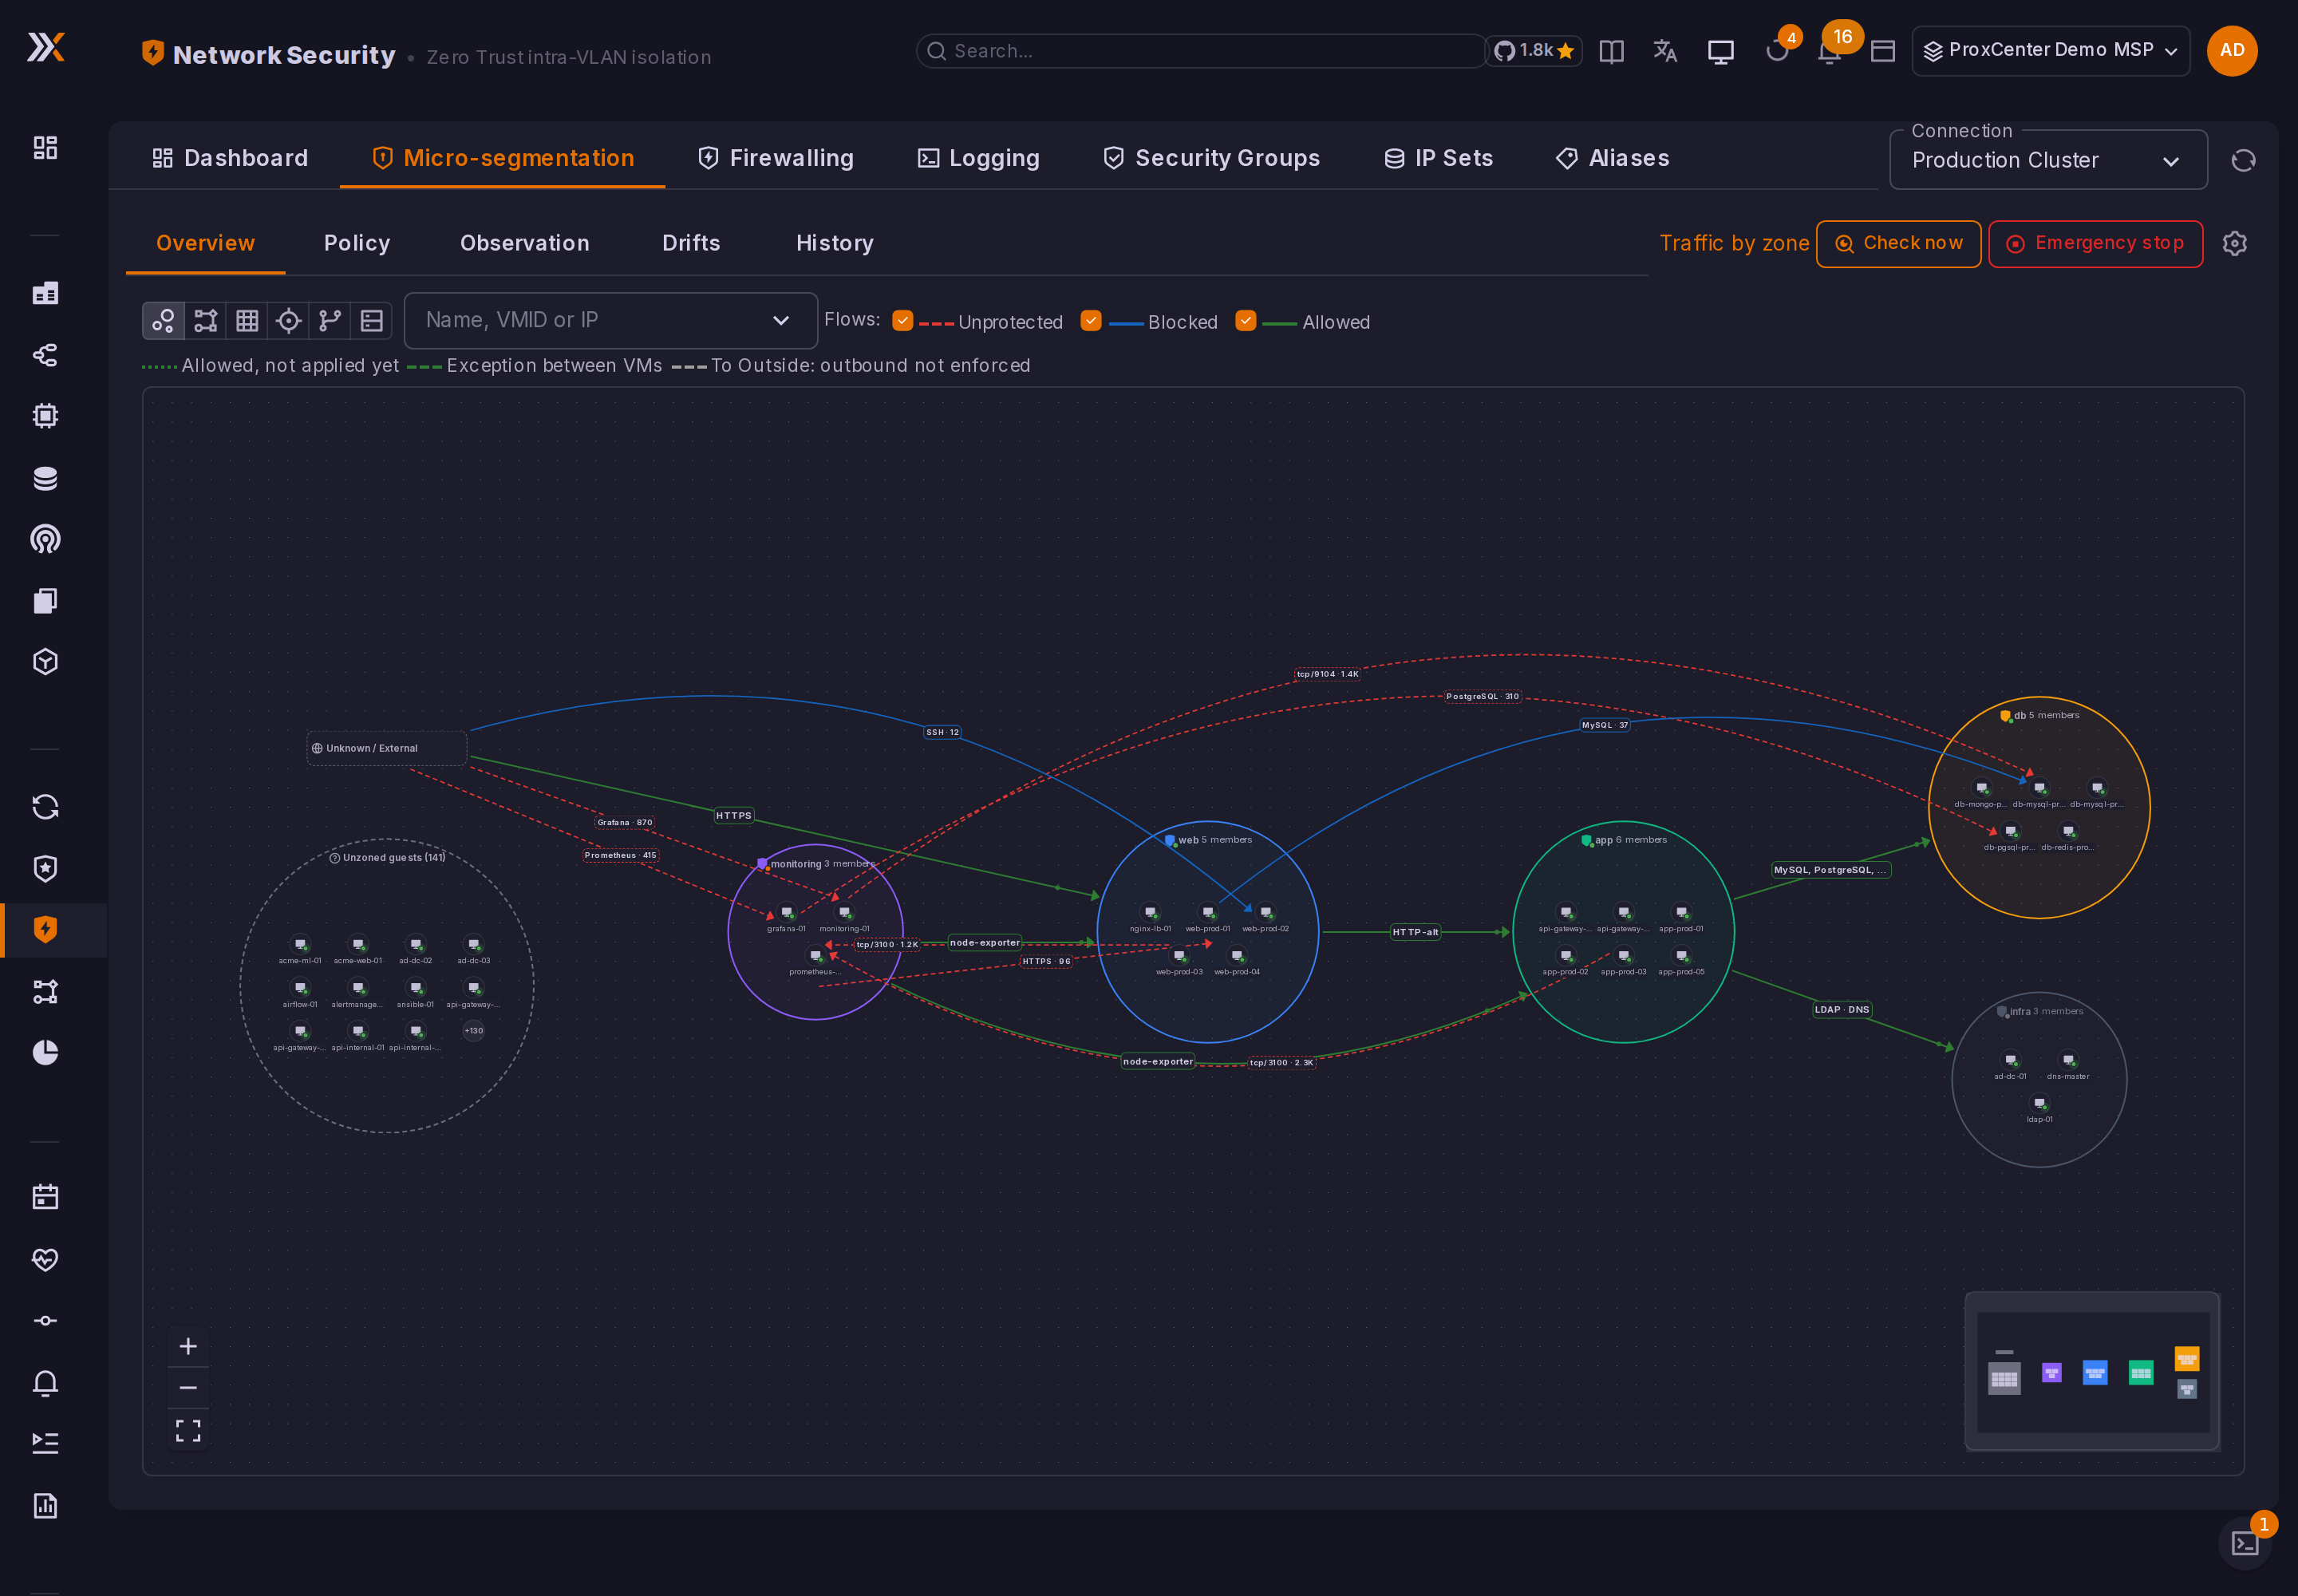
How it works
| Concept | What it is in Proxmox |
|---|---|
| Zone | A group of guests. Membership is a Proxmox tag on the guest: the tag prefix (zone- by default) followed by the zone name, for example zone-web. Tag a new guest and the engine protects it at its next pass, with no other step. |
| Flow | Traffic the policy allows: from a zone or a CIDR, to a zone or a CIDR, on a protocol and ports. Both ends cannot be CIDRs. |
| Exception | A narrow opening between chosen VMs, on named services, whatever the flows and the isolation of the zone say. |
| Inbound state | Disabled (not applied), Observing (traffic outside the policy is logged, nothing is blocked) or Blocking (only the flows of the policy get in). |
| Outbound state | Not controlled, Observing or Blocking, with a filter to the Local network or to the Local network and Internet. |
ProxCenter keeps the policy as a draft. Nothing is written to Proxmox until you review the plan and apply it; each apply records a revision you can restore later.
Everything ProxCenter creates in Proxmox is named pcz-* or carries a comment starting with [pc-microseg]: a cluster security group and an IP set per zone, plus the shared sets pcz-_local and pcz-_known used by the outbound control. On each member, ProxCenter inserts the zone group at the top of the guest rules, turns the firewall on for each network card and sets the guest options. The engine never changes or deletes an object without that marker. Rules you add by hand stay where they are: your DROP rules keep applying, and your ACCEPT rules show up as drifts. A Proxmox object that uses a pcz-* name without the marker blocks the apply until you rename or delete it.
Zone names are 1 to 14 characters: lowercase letters, digits and dashes. The limit comes from Proxmox, which caps security group names at 18 characters, pcz- included.
Requirements
- The ProxCenter orchestrator runs the engine. On a high-availability install, only the leader orchestrator writes to Proxmox.
- The cluster firewall must be on. The pre-flight checks say so and open the deployment wizard when it is off.
- Guests need a known IP address, so that the zone IP sets list them: from the QEMU guest agent, the cloud-init
ipconfig, or the container'sip=setting. Members without one appear in Drifts. - Micro-segmentation is a provider feature: a vDC tenant does not see it.
Getting started
On a connection with no policy yet, the tab shows three steps:
- Run the pre-flight checks. Check that the cluster and its firewall are ready.
- Create your first zone. Group the guests that talk to each other.
- Preview the plan. See what would change on Proxmox before anything is written.
Then observe for a while, accept the flows you recognise, and block zone by zone. The recommended order:
- Create the zones and assign the guests (Policy > New zone, then Assign guests).
- Declare the flows you already know (New flow).
- Apply the plan with the zones in Observing.
- Review Observation daily: accept what is legitimate, dismiss the rest.
- When a zone has seen no pending traffic that would be blocked for the observation window (24 hours by default), it shows as ready. Switch it to Blocking.
- Do the same for the outbound traffic, zone by zone, if you need it.
Pre-flight checks
Policy > Pre-flight checks reads the cluster and reports each check as passed, warning or failed.
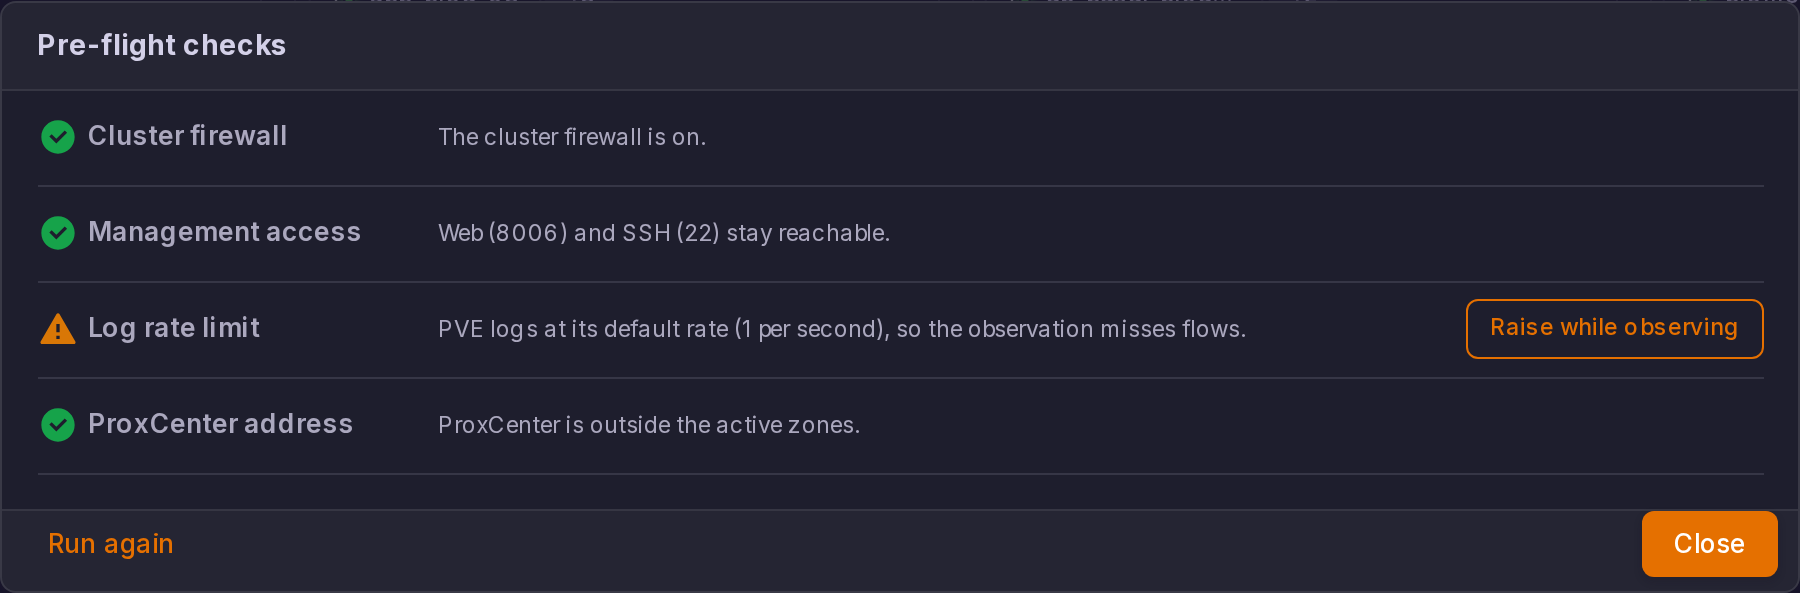
| Check | What it verifies |
|---|---|
| Cluster firewall | The Proxmox cluster firewall is on. When it is off, Open the deployment wizard reads the nodes, then turns the cluster firewall on and changes nothing else: no rule, no policy. It names the nodes whose own firewall would turn on with the cluster, so you can check their management access first. |
| Management access | The web UI (8006) and SSH (22) stay reachable from ProxCenter on every node whose own firewall is on, through a host rule, the cluster rules, or the Proxmox management IP set. |
| Log rate limit | Proxmox logs one line per second per chain by default, so the observation misses flows. Raise while observing sets a higher limit while a zone is observed, and sets it back afterwards. |
| ProxCenter address | ProxCenter is not inside a zone it could be cut off by. For a zone that controls its outbound traffic, allow a flow to the Proxmox nodes before blocking. |
| Outbound subnets | Every member of a zone with outbound control has a known subnet. A member without one has its local network reduced to its own addresses. |
When ProxCenter runs in Docker, the address it detects can be internal to Docker. In Settings > Advanced, enter the address of the host as Proxmox sees it, or the management access check cannot tell whether ProxCenter would be cut off.
Overview
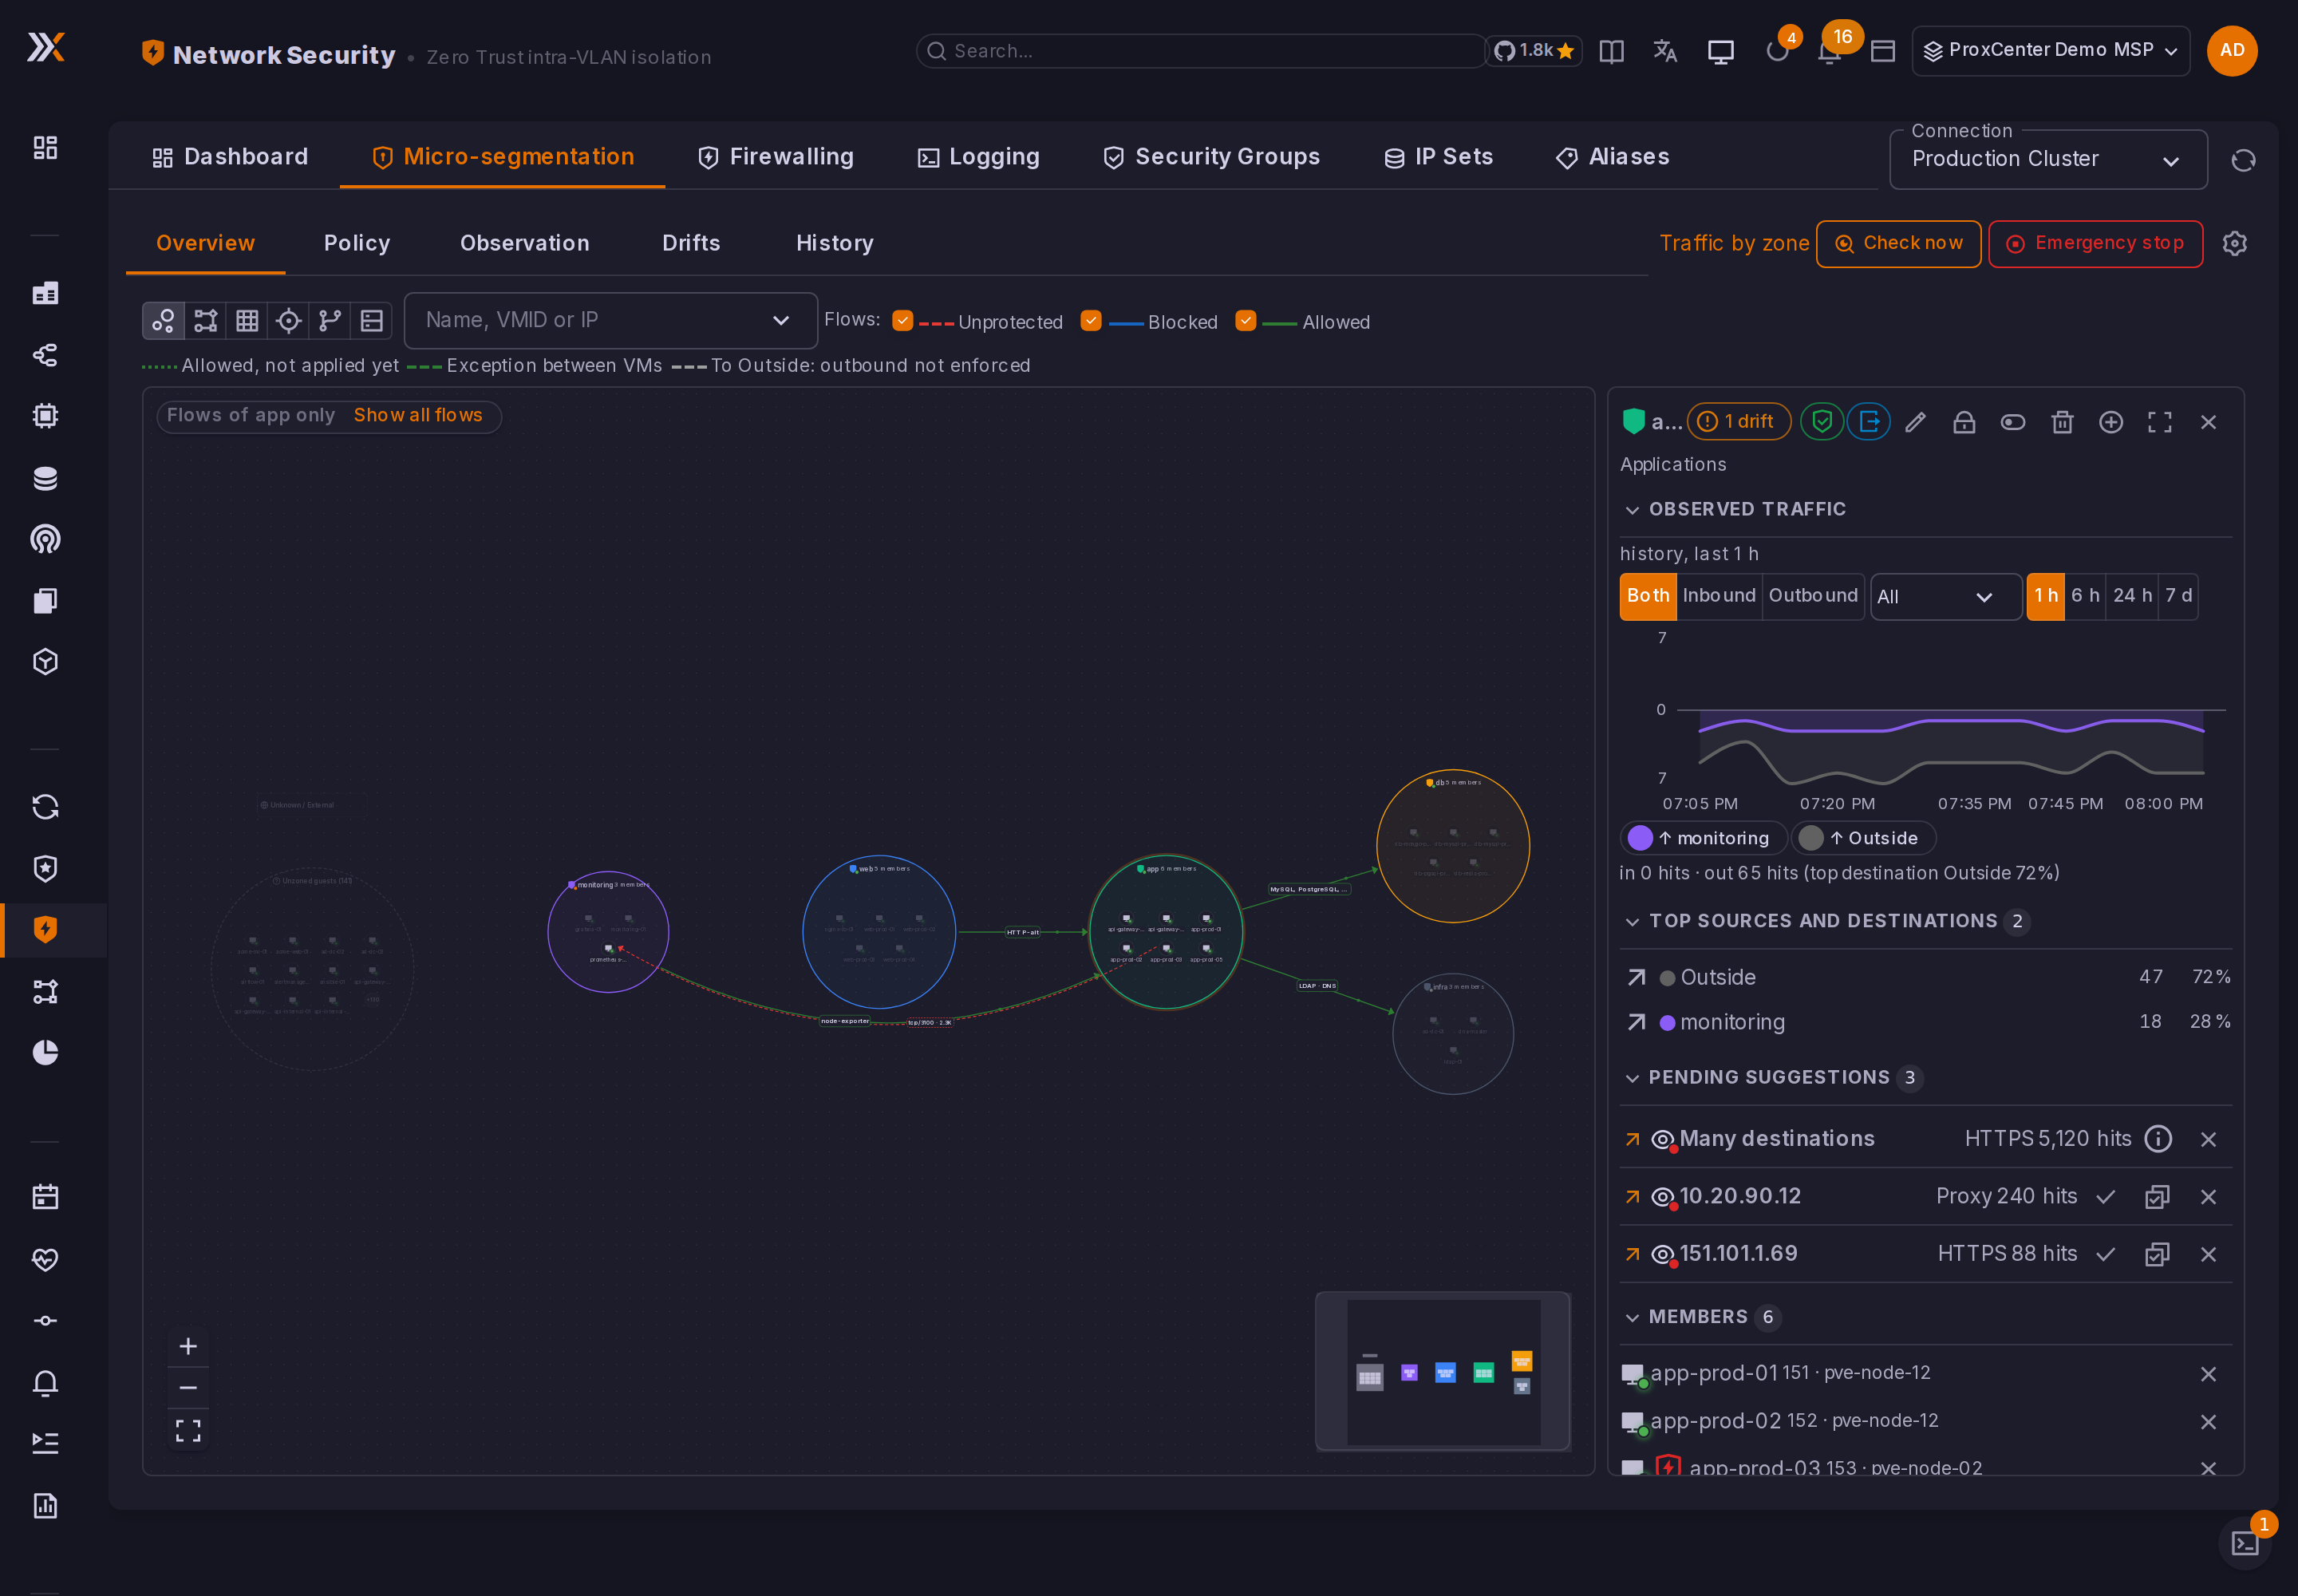
The Overview sub-tab draws the policy and the observed traffic. Six renderings sit in the toolbar:
| Rendering | Best for |
|---|---|
| Groups | Zones as circles holding their guests |
| Compact zones | One box per zone, for many zones |
| Matrix | Sources by destinations, for any number of zones |
| Guest view | One zone and its guests, with what talks to them |
| Sankey diagram | The observed traffic as ribbons, wider with more hits |
| Nodes | The guests on their Proxmox node, with the observed flows and the exceptions from node to node |
The Flows checkboxes show or hide the Unprotected (observed, allowed by no flow), Blocked and Allowed edges. Target a VM (name, VMID or IP) keeps the map focused on one guest and lists its observed flows and the allowed flows of its zone. Allowed flows carry no counter: Proxmox does not log what it lets through.
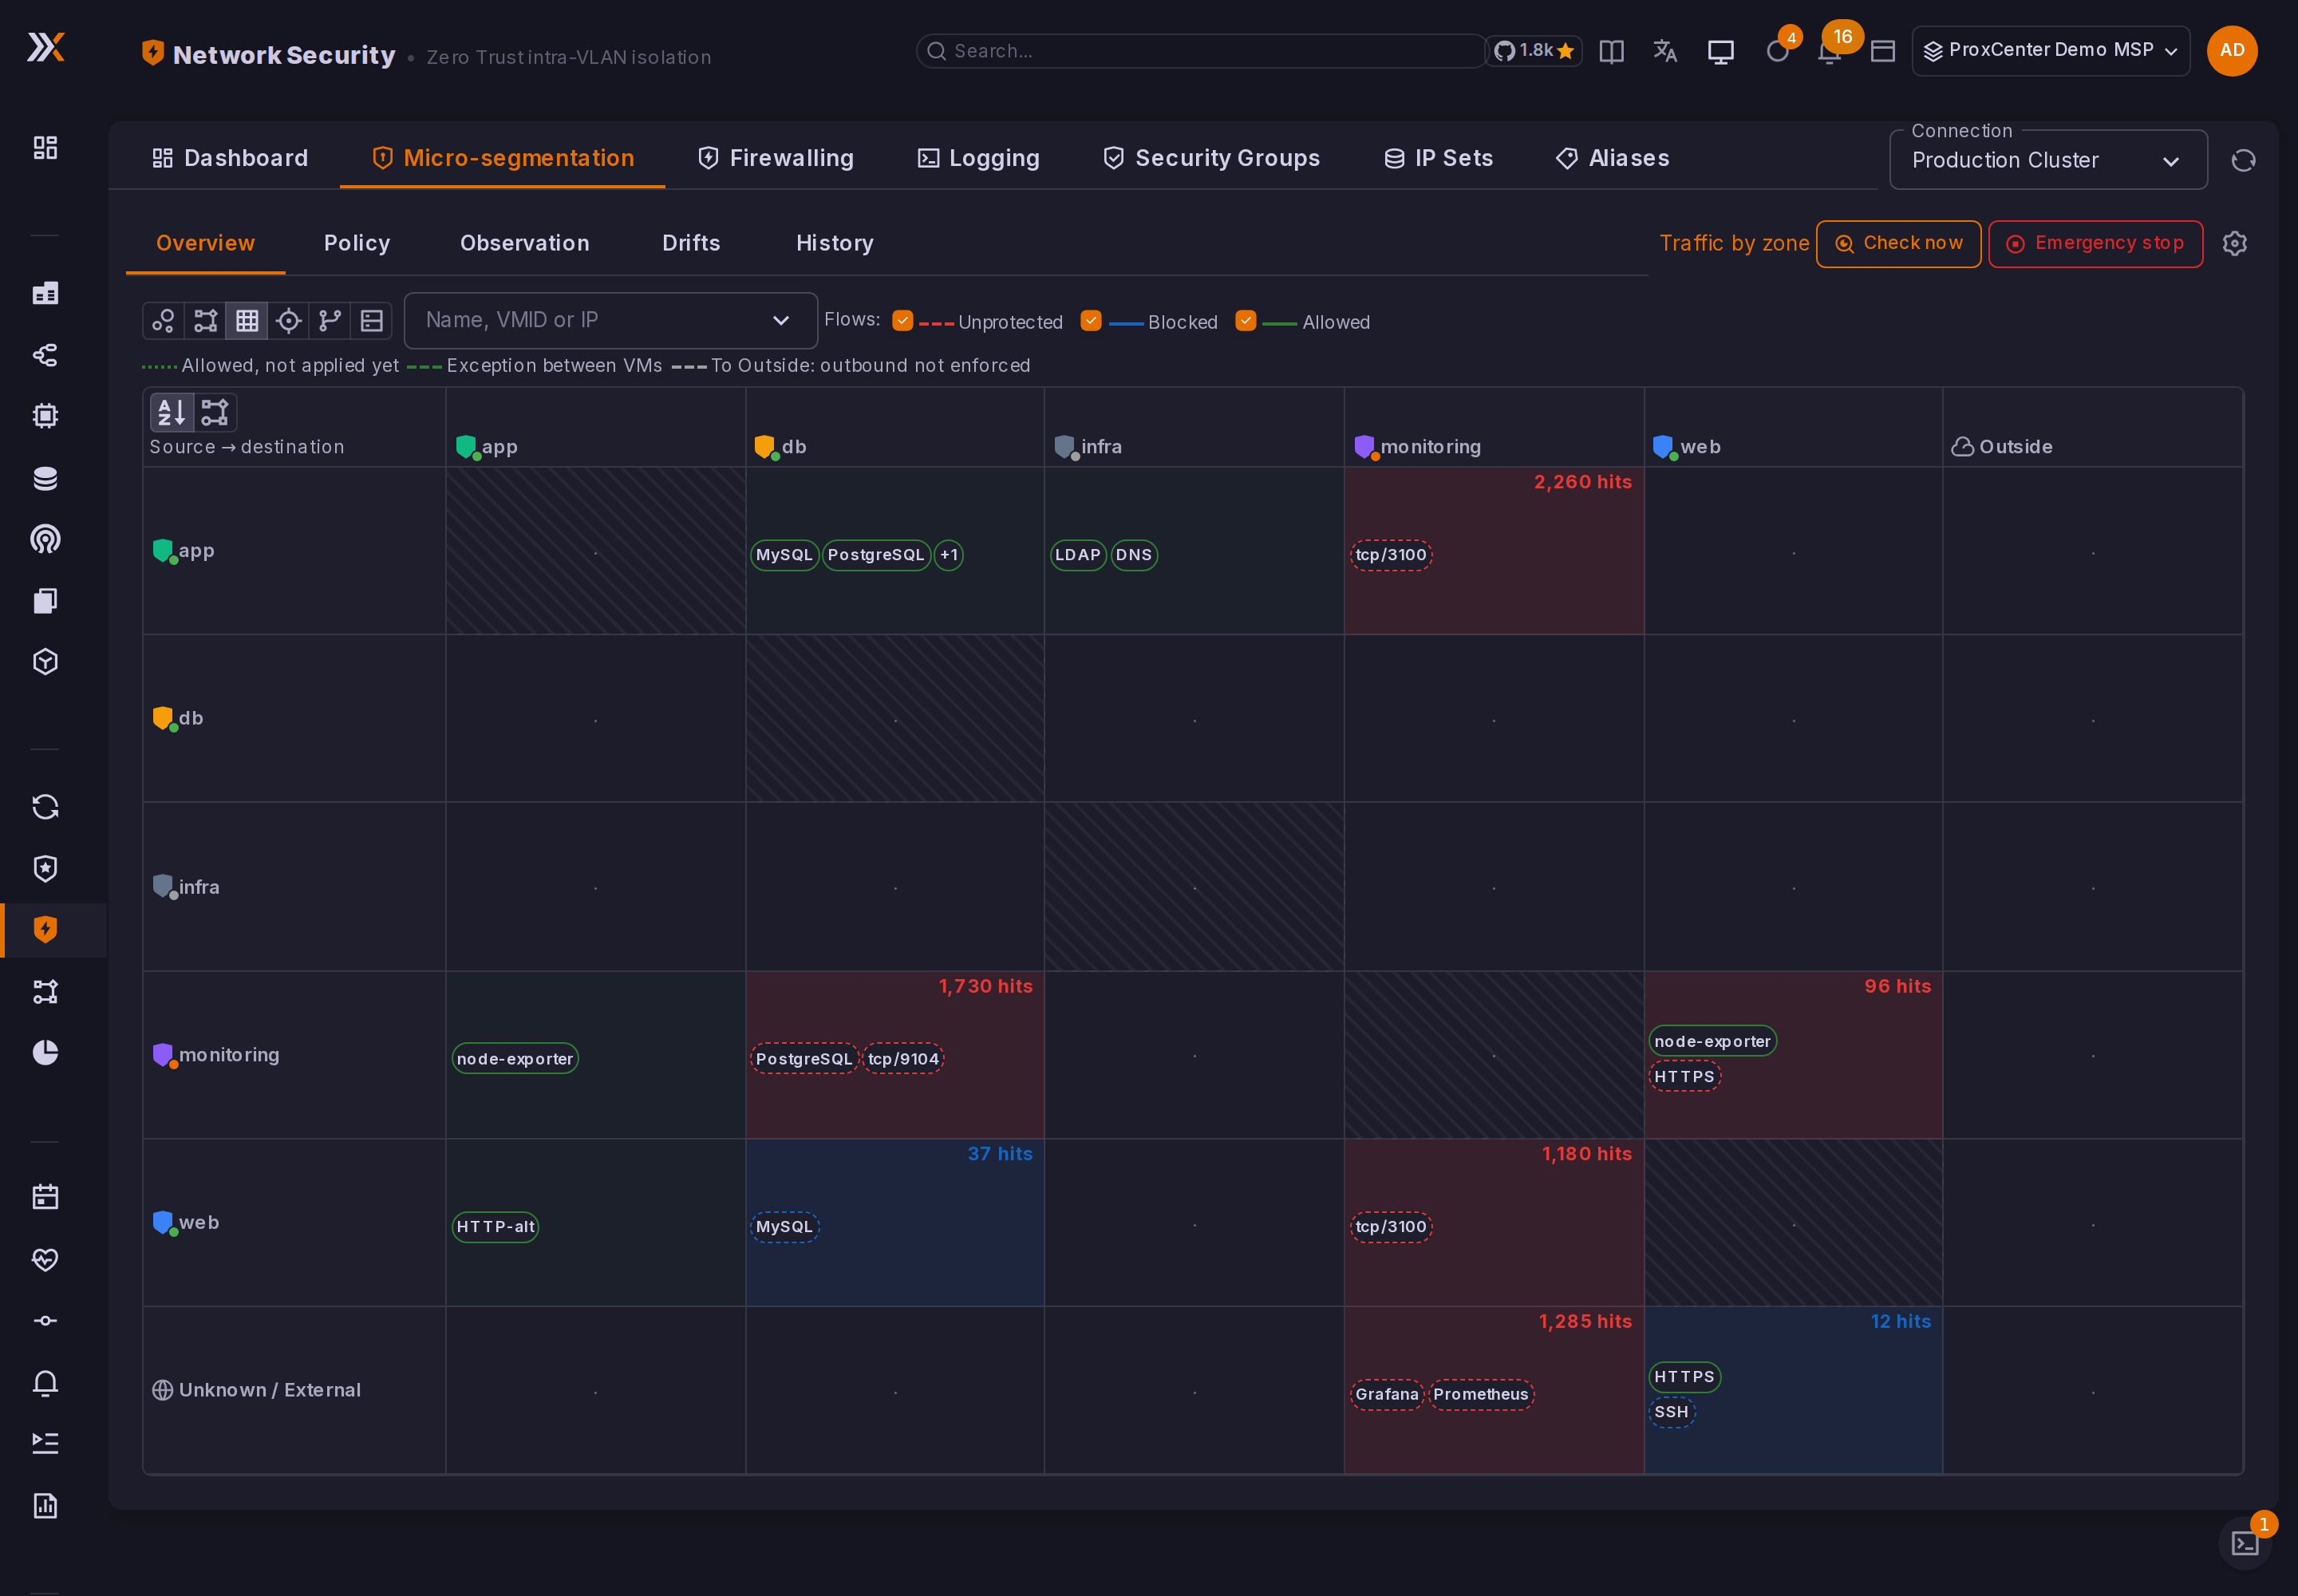
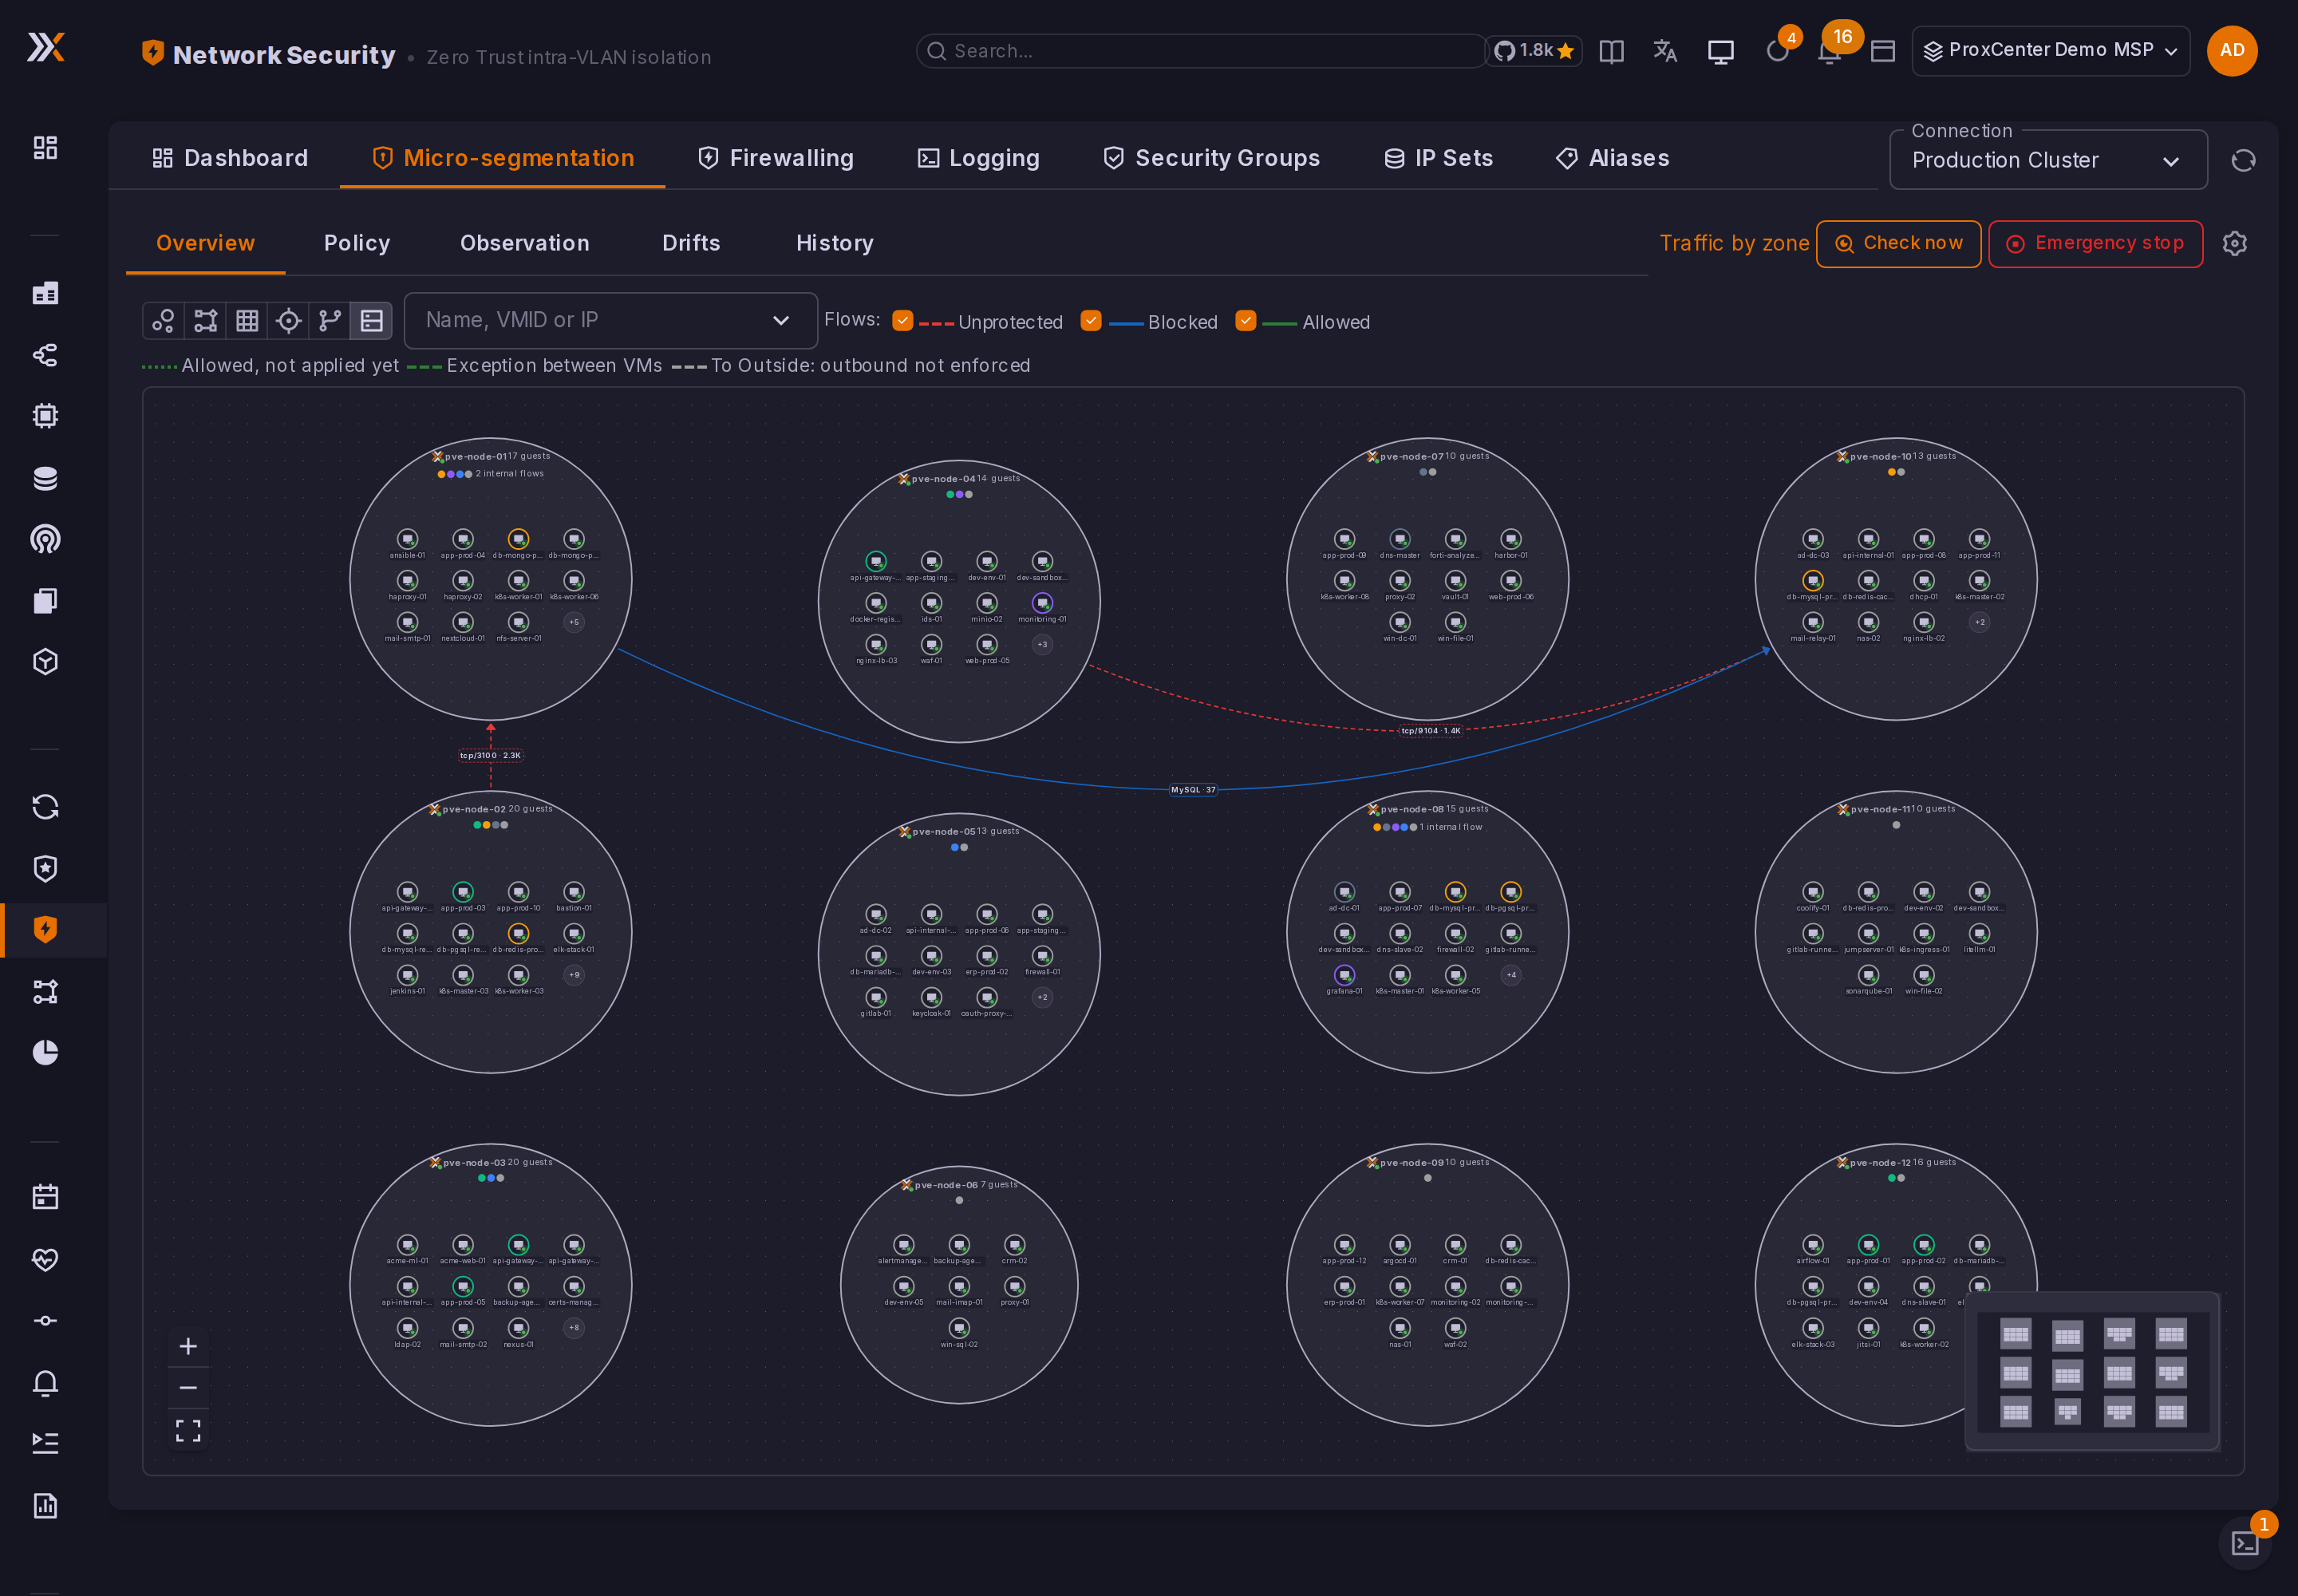
Click a zone to open its panel: observed traffic over 1 hour to 7 days, inbound and outbound, the top sources and destinations, the pending suggestions with their actions, the members, the flows and the exceptions. The panel actions edit the zone, change its state, block or reopen its outbound traffic, and Expand opens it in a larger dialog with Traffic, Data and Logs tabs. Clicking an edge between two zones opens the same kind of panel for that pair.
Policy
The Policy sub-tab holds the zone cards and the flow table.
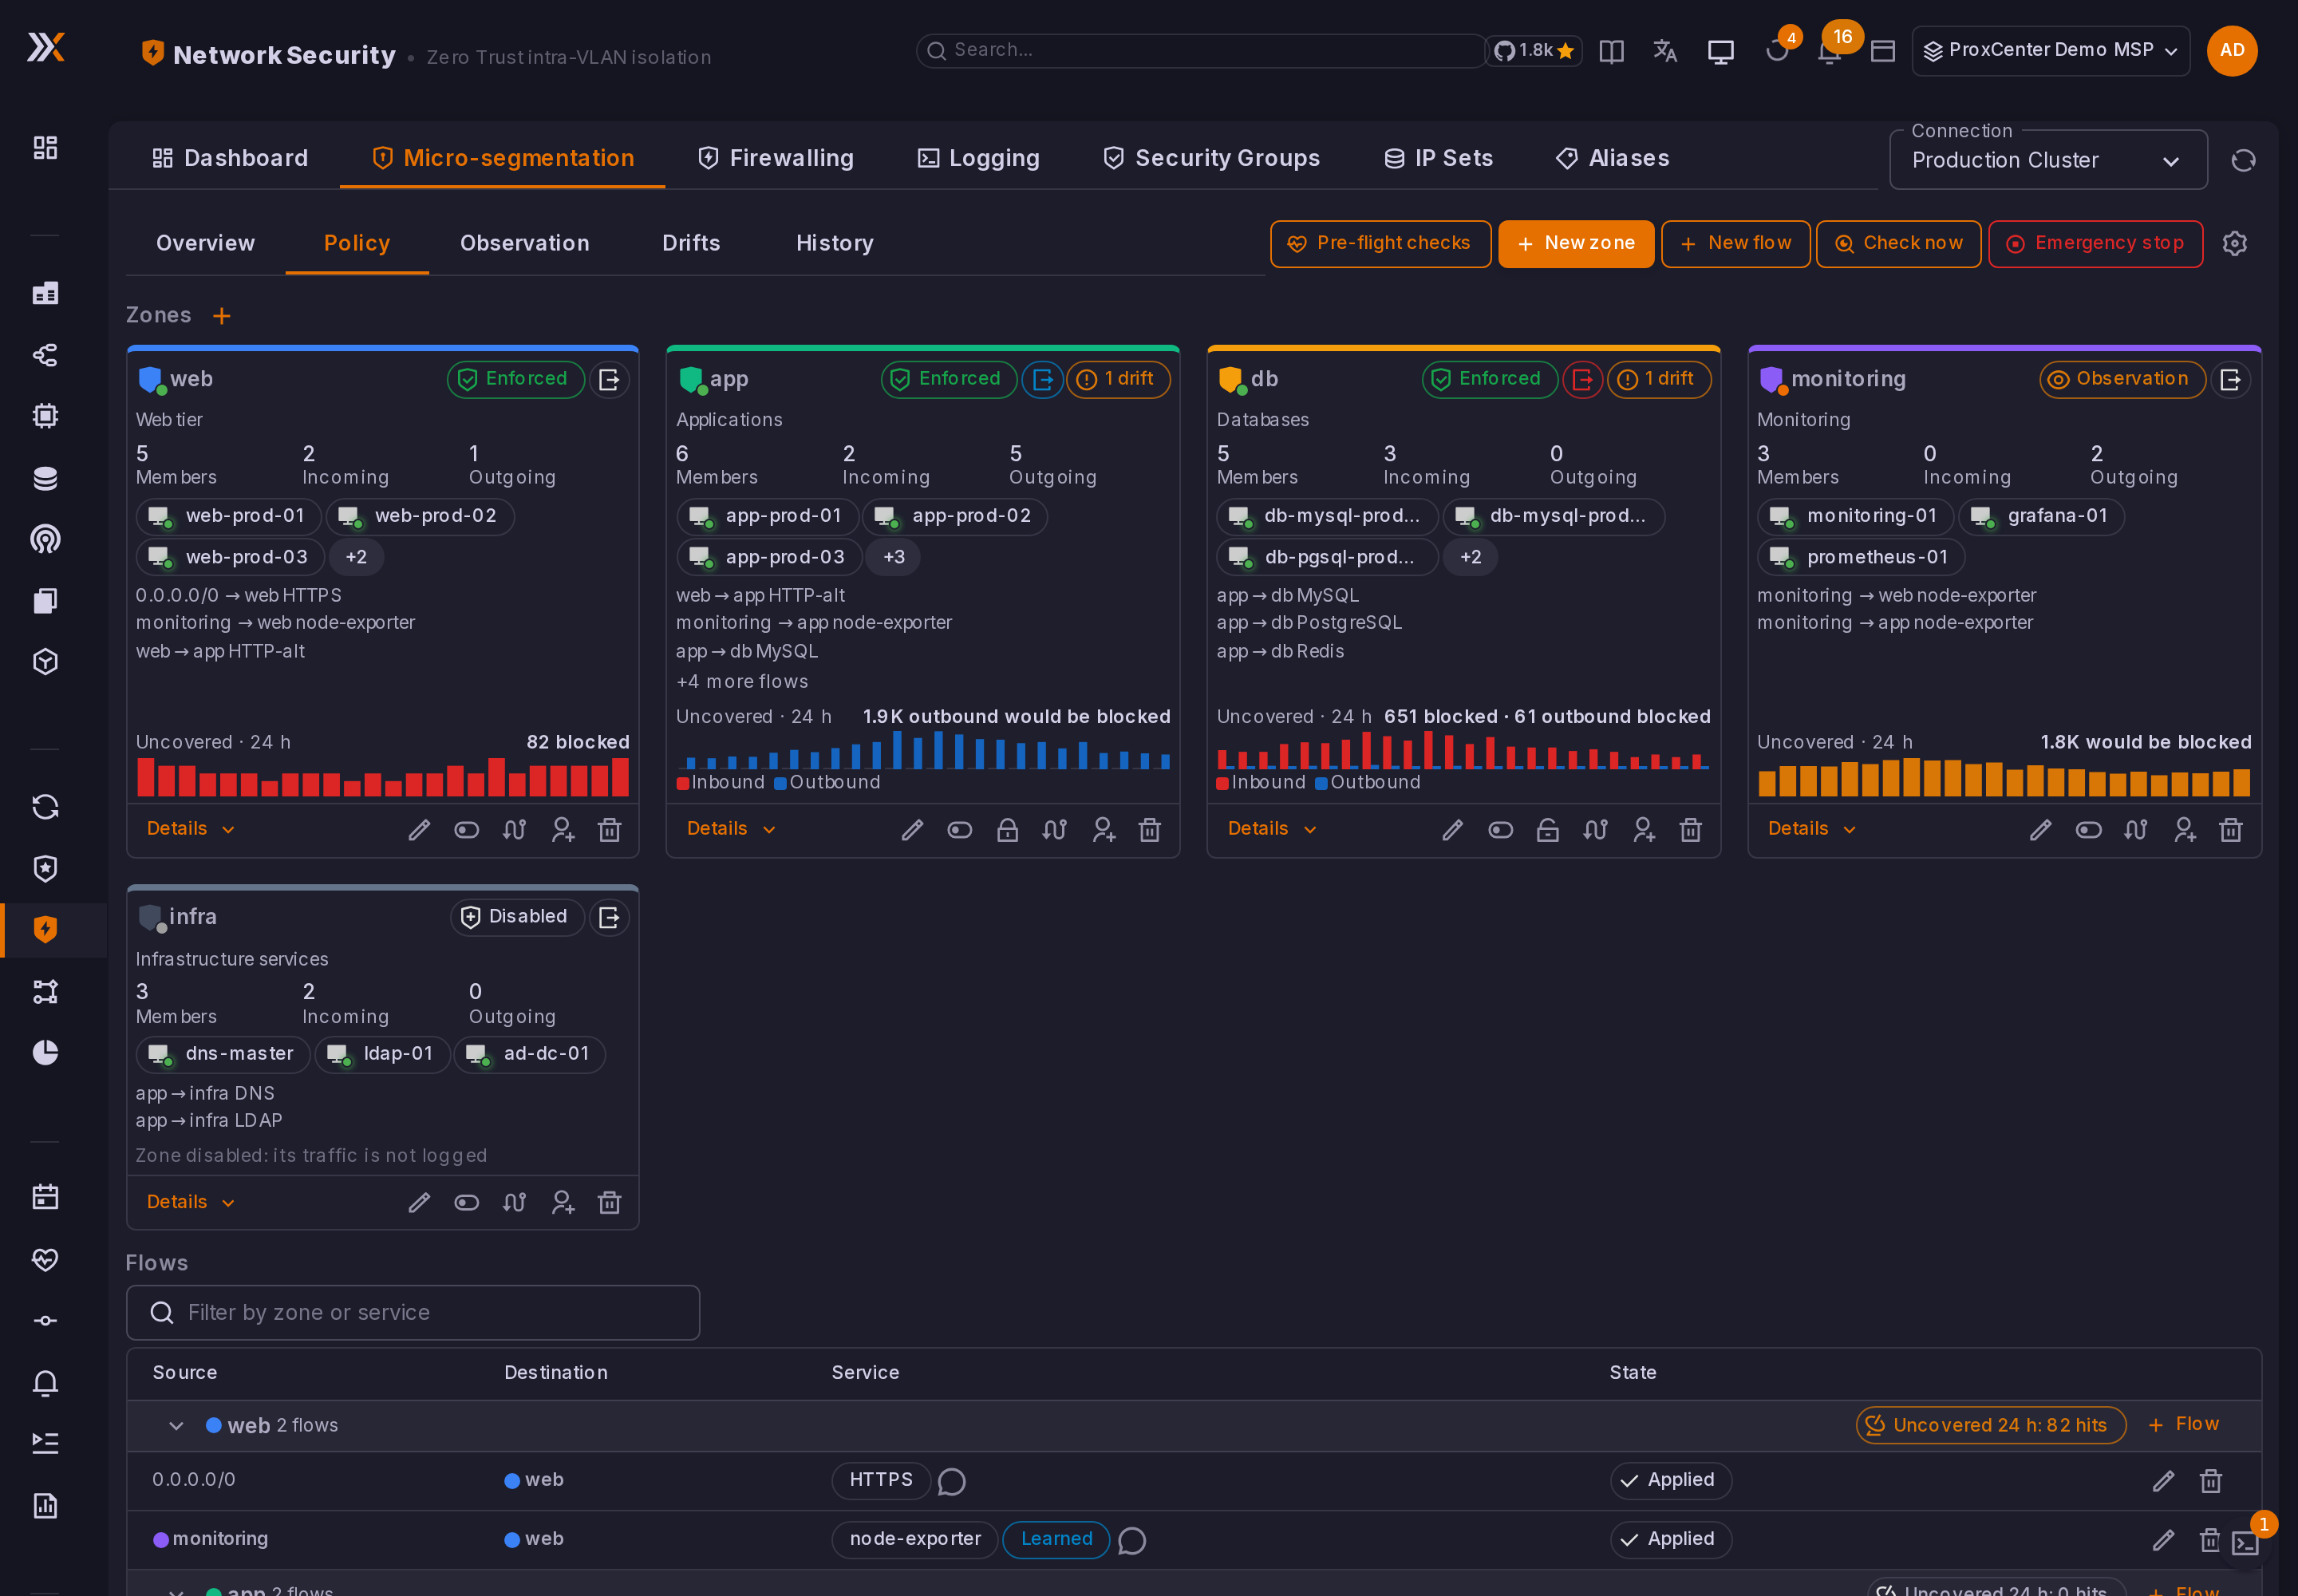
Each zone card shows the inbound state, the outbound state, the drifts of its members, the member chips, its flows, and a sparkline of the last 24 hours of traffic that no flow covers, inbound and outbound. Its actions edit the zone, change its state, block or reopen its outbound traffic, add a flow into it, assign guests, and delete it.
The flow table groups the flows by destination zone. Each row has a state: Applied, Pending add, Pending change, Pending removal, or Not applied for a flow to a CIDR whose source zone does not control its outbound traffic. Learned marks a flow accepted from the observation. The group header shows the traffic into the zone that no flow covers over the last 24 hours.
Zones
New zone or Edit zone opens the zone dialog.
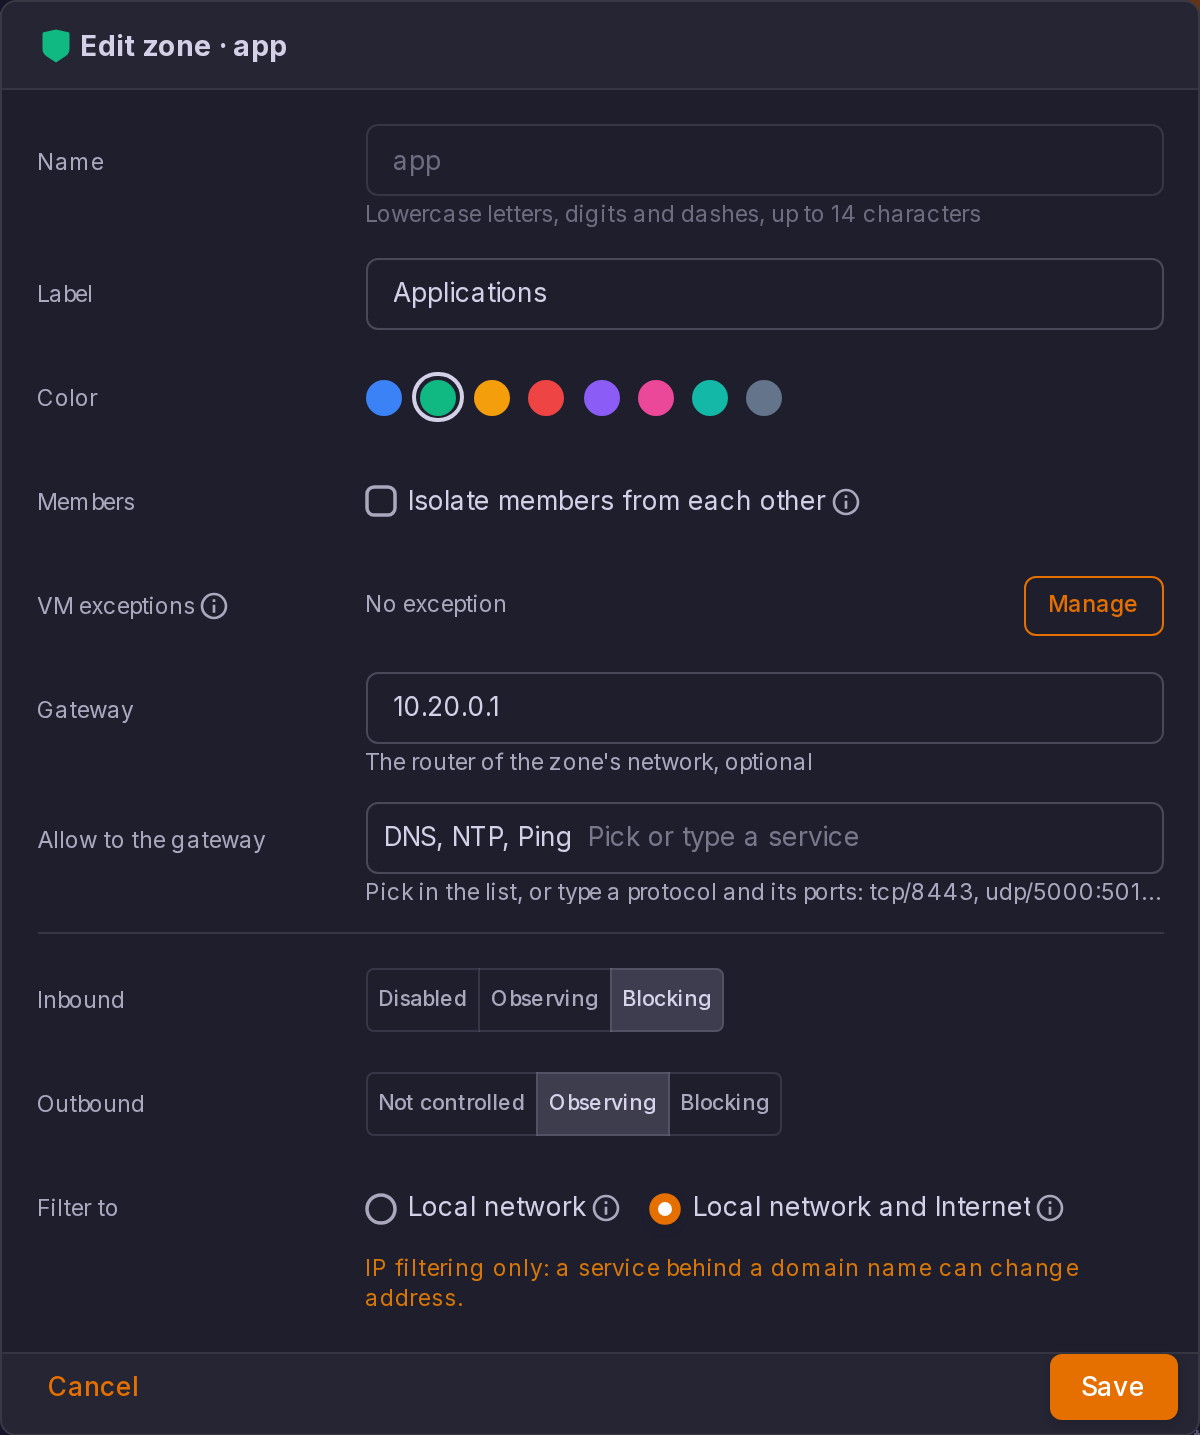
| Field | Effect |
|---|---|
| Isolate members from each other | Unchecked, the members of the zone talk to each other freely. Checked, they reach each other only through a declared flow or an exception. |
| VM exceptions | Opens the exception table of the zone. |
| Gateway | The router of the zone's network, optional. It is named on the map and in the Observation. |
| Allow to the gateway | Services allowed to the gateway: DNS, NTP and Ping are offered first. Pick in the list or type a protocol and its ports, such as tcp/8443, udp/5000:5010, icmp or any. |
| Inbound | Disabled, Observing or Blocking. |
| Outbound | Not controlled, Observing or Blocking. Requires the inbound to be observing or blocking. |
| Filter to | Local network filters outbound traffic to the subnets of the zoned VMs, unzoned VMs included, and leaves Internet open. Local network and Internet filters everything: only the flows of the policy go out. |
Outbound filtering works on IP addresses only. A service reached through a domain name can change address and be blocked: allow it with a wider CIDR, or keep that zone on Local network.
Moving a zone to Blocking, inbound or outbound, asks you to type the zone name. The dialog says whether the zone is ready: nothing would have been blocked during the observation window. Ready is an indicator, not a lock. A state change is applied to Proxmox right away as a new revision, so it is refused while the draft holds other changes: apply or discard them first.
Assigning guests
Assign guests lists the guests of the connection with a search by name or VMID. Assigning a guest that already belongs to another zone moves it. The tags are written on the next apply; until then the member shows as Pending. A guest carrying the tags of several zones is left alone until it is assigned to a single one.
Flows
New flow takes a source (zone or CIDR), a destination (zone or CIDR), a protocol, ports (80, 443, 8000:8100, or empty for all ports) and a comment. A flow from zone A to zone B opens the inbound of B and, when A controls its outbound traffic, the outbound of A: you declare it once.
Exceptions
An exception lets chosen VMs reach chosen members of the zone on the services you name, whatever the flows and the isolation of the zone say. Use it for one administration host, a backup agent or a single database client, without opening a whole zone pair.
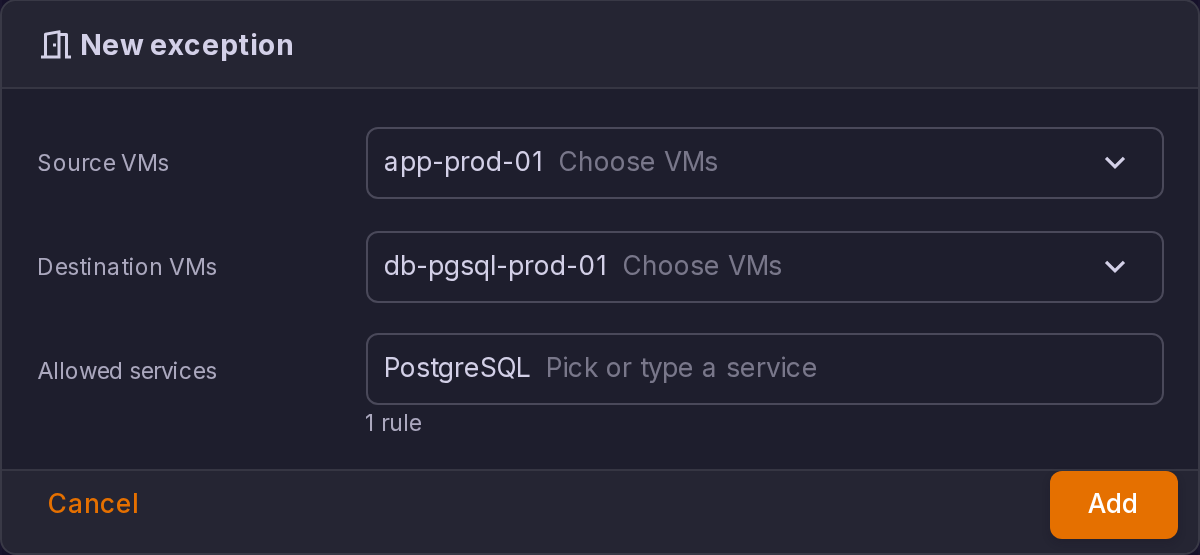
An exception holds at most 50 rules; past that, allow a flow of the zone instead. A VM cannot be both a source and a destination. The exception table of the zone shows a status for each exception that is not active:
| Status | Meaning |
|---|---|
| Zone not applied | The zone is neither observing nor blocking: nothing of the exception is written. |
| No destination in the zone | None of its destinations is a member of the zone yet. |
| VM not found | A source or a destination is no longer in the inventory. |
| Address unknown | The inventory knows no address of a source yet. |
| Name changed | A VM was renamed, or its VMID was reused: check that the exception still names the right VM. |
The map draws exceptions as dashed edges between guests, and the Firewalling tab shows their rules as engine rules, edited from their zone.
Plan and apply
Every change of zones, flows, exceptions, members or tag prefix lands in the draft. A strip lists what is not applied yet, with Review and apply and Discard changes. The plan reads Proxmox and lists every write, grouped into cluster objects and one section per guest, before anything is written. Apply runs the steps one after the other and shows each step as waiting, being written, done, failed or not run.
The plan also reports:
- Proxmox objects that use a ProxCenter name without being ProxCenter's: the apply is blocked until you rename or remove them.
- Rules added by hand in ProxCenter's security groups: they are kept, not touched.
- Guests that could not be read: they are handled at the next pass.
Observation
The Observation sub-tab lists the traffic the firewall logged that the policy does not cover, grouped by zone.
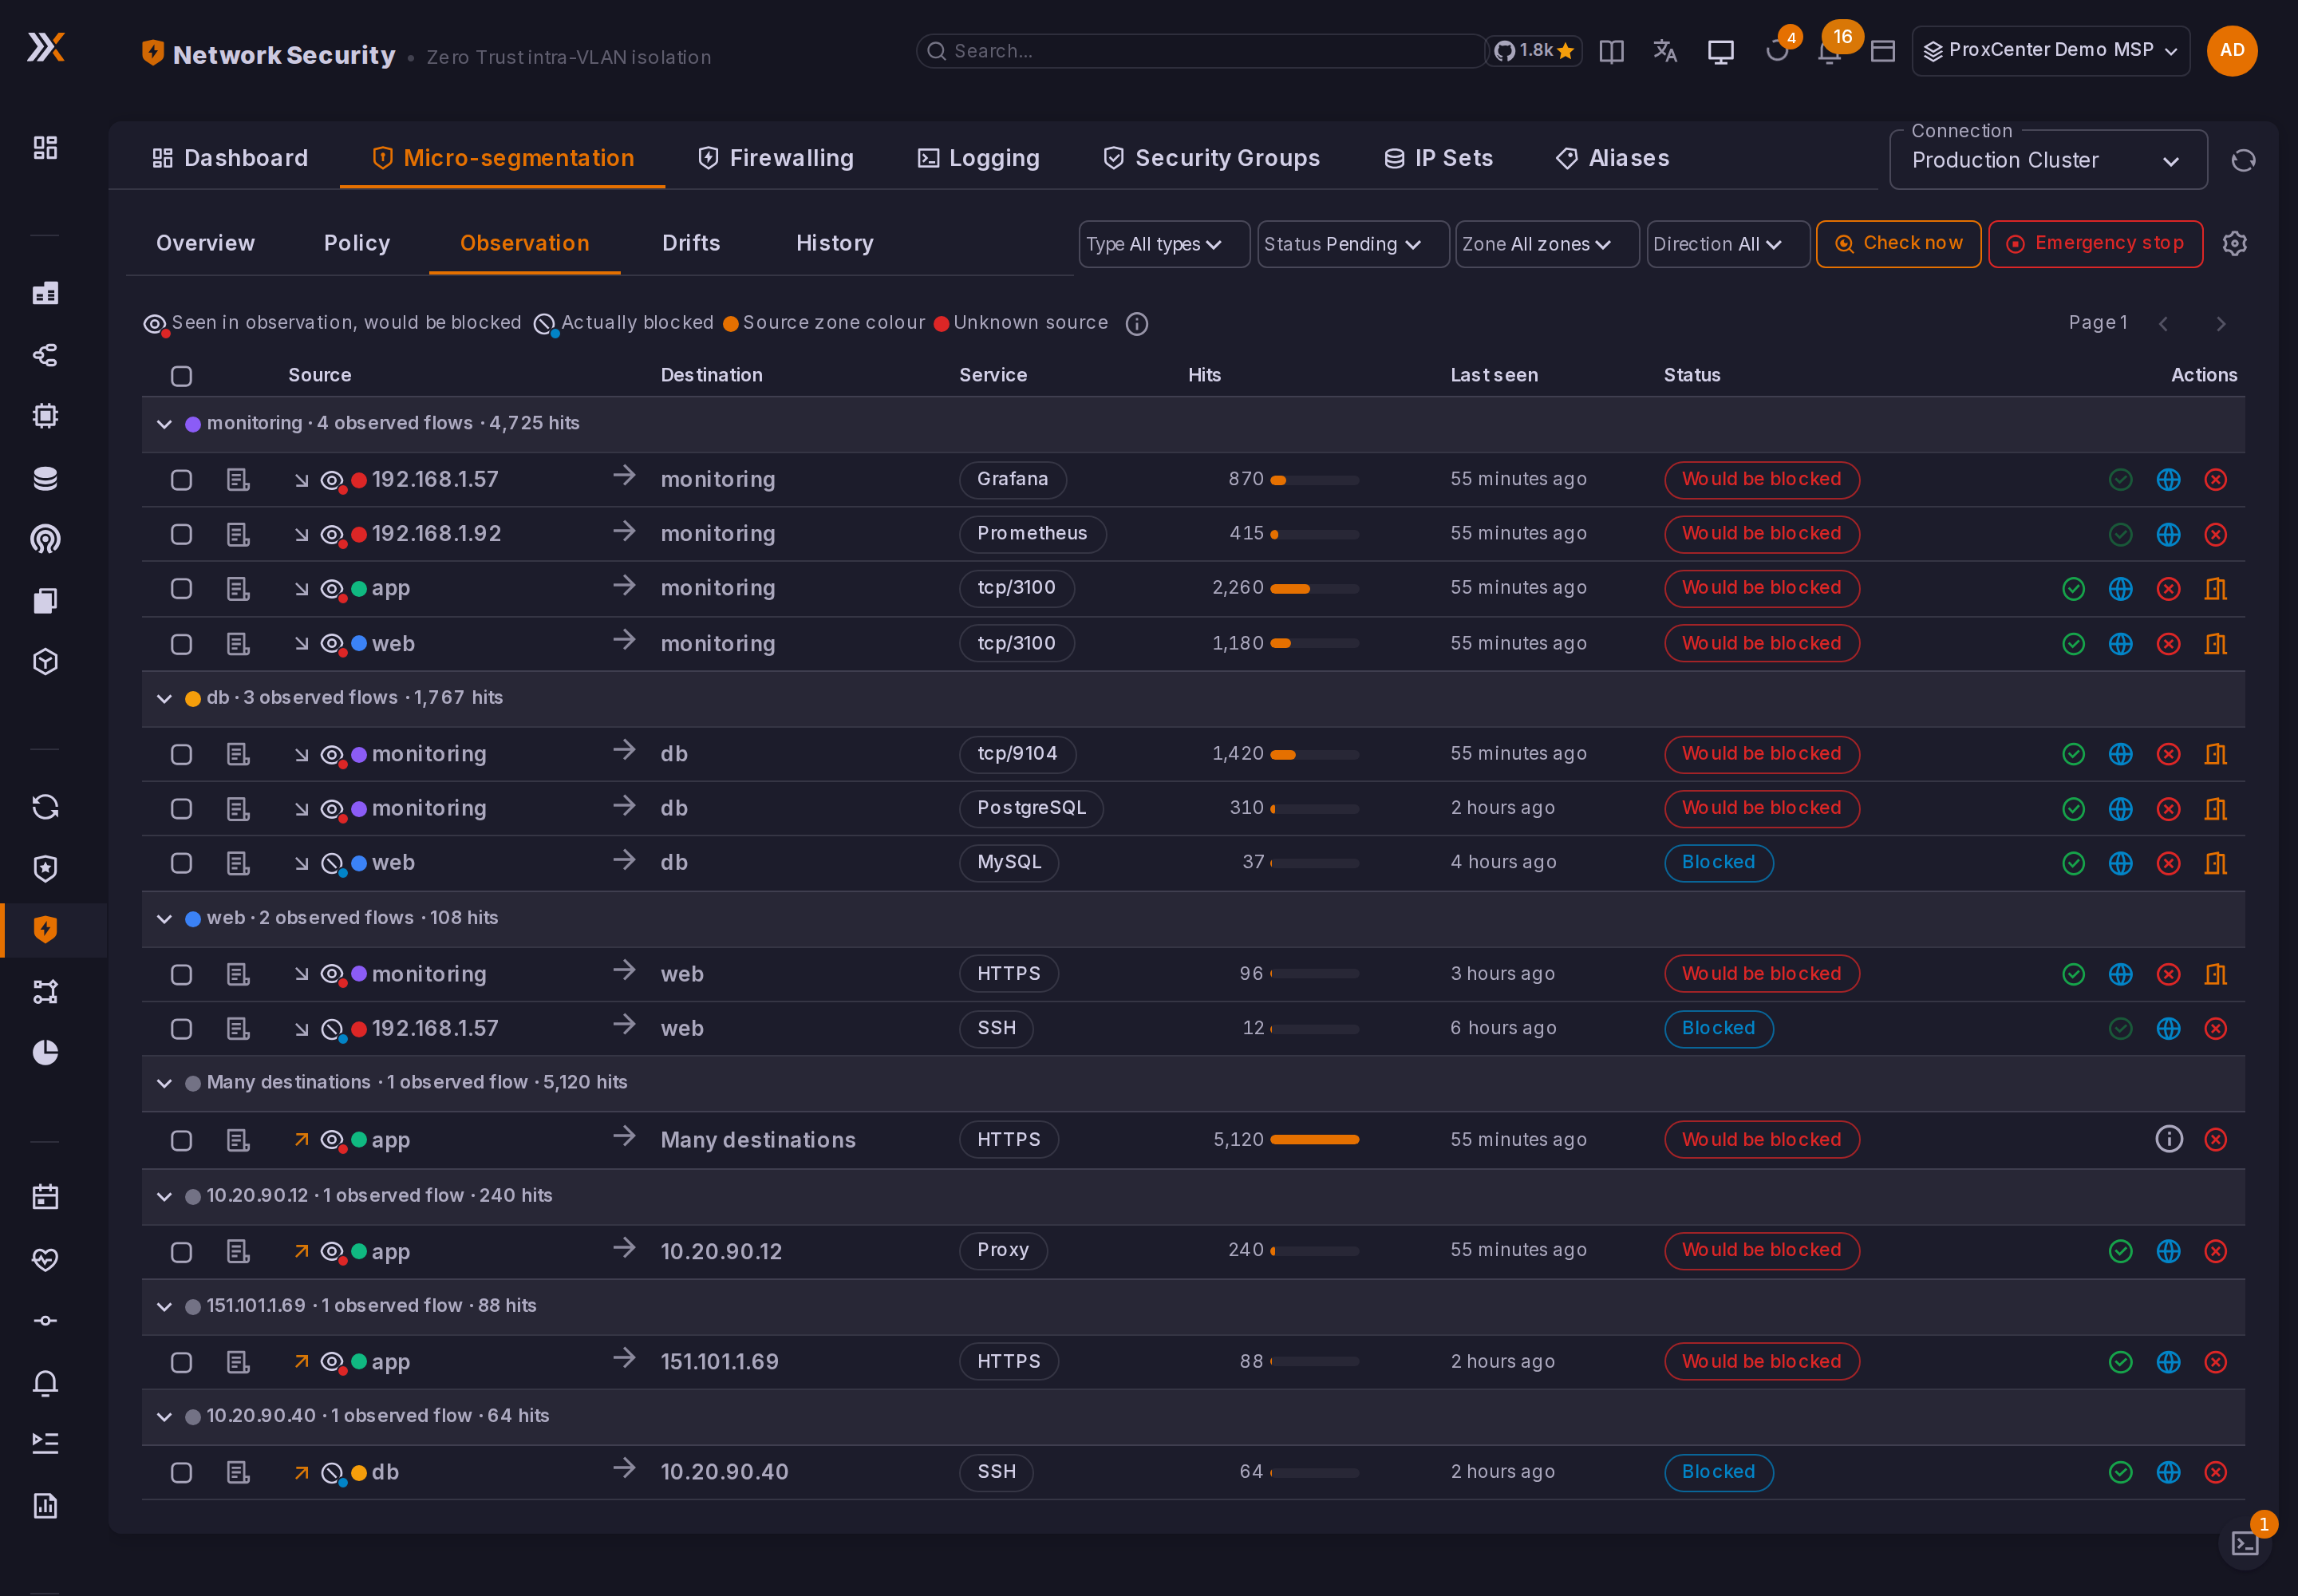
- Would be blocked: seen in observation, outside the policy.
- Blocked: actually dropped by a zone in blocking.
Filter by Type, Status (Pending, Accepted, Dismissed), Zone and Direction (Inbound, Outbound). Each row offers:
| Action | Effect |
|---|---|
| Accept | Creates the flow between the two zones in the draft. |
| As CIDR | Creates the same flow with the source address as a range, needed when the source is in no zone. For an outbound destination, you choose the prefix length. |
| Allow this flow only | For a flow between two known VMs: opens a pre-filled exception instead of opening the whole zone pair. |
| Dismiss | Hides the suggestion for this pair. |
Select several rows to accept, accept as CIDR or dismiss them in one action. An outbound flow accepted towards a zone also allows the inbound of its destination zone.
Details opens the flow: direction, destination, service, hits, first and last seen, a sample pair of addresses, 24 hours of traffic, and the recent occurrences with the guest reached and its node.
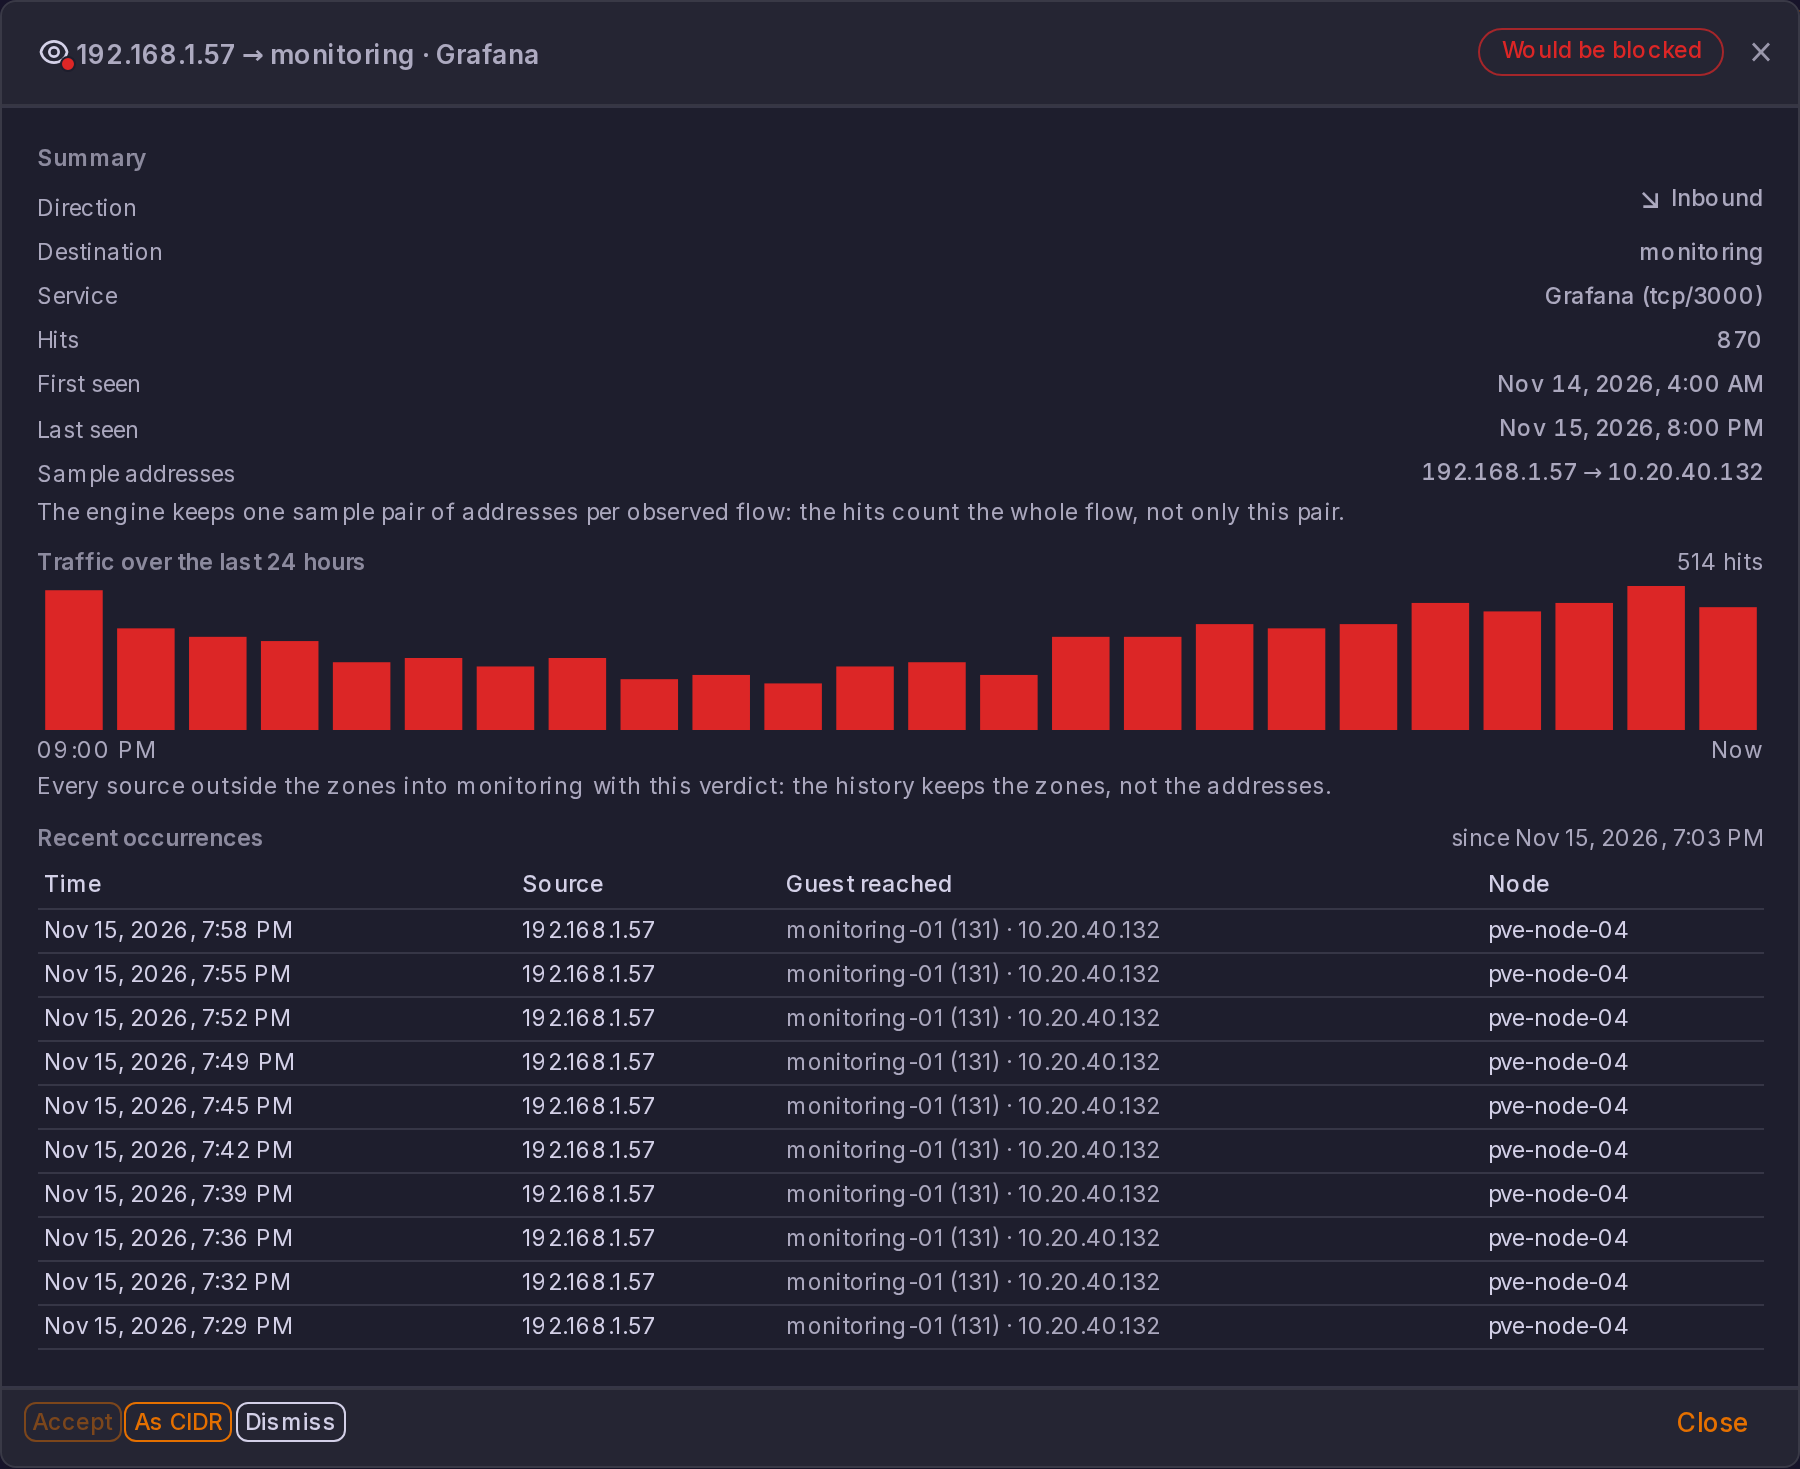
The observation is sampled. Proxmox logs at most one line per second per chain by default, so busy flows are under-counted, and the engine keeps one sample pair of addresses per observed flow: the hits count the whole flow, not only that pair. Raise the log rate limit in the settings while you observe.
Drifts
The Drifts sub-tab lists the differences between the policy and Proxmox found by the last full check, grouped by kind.
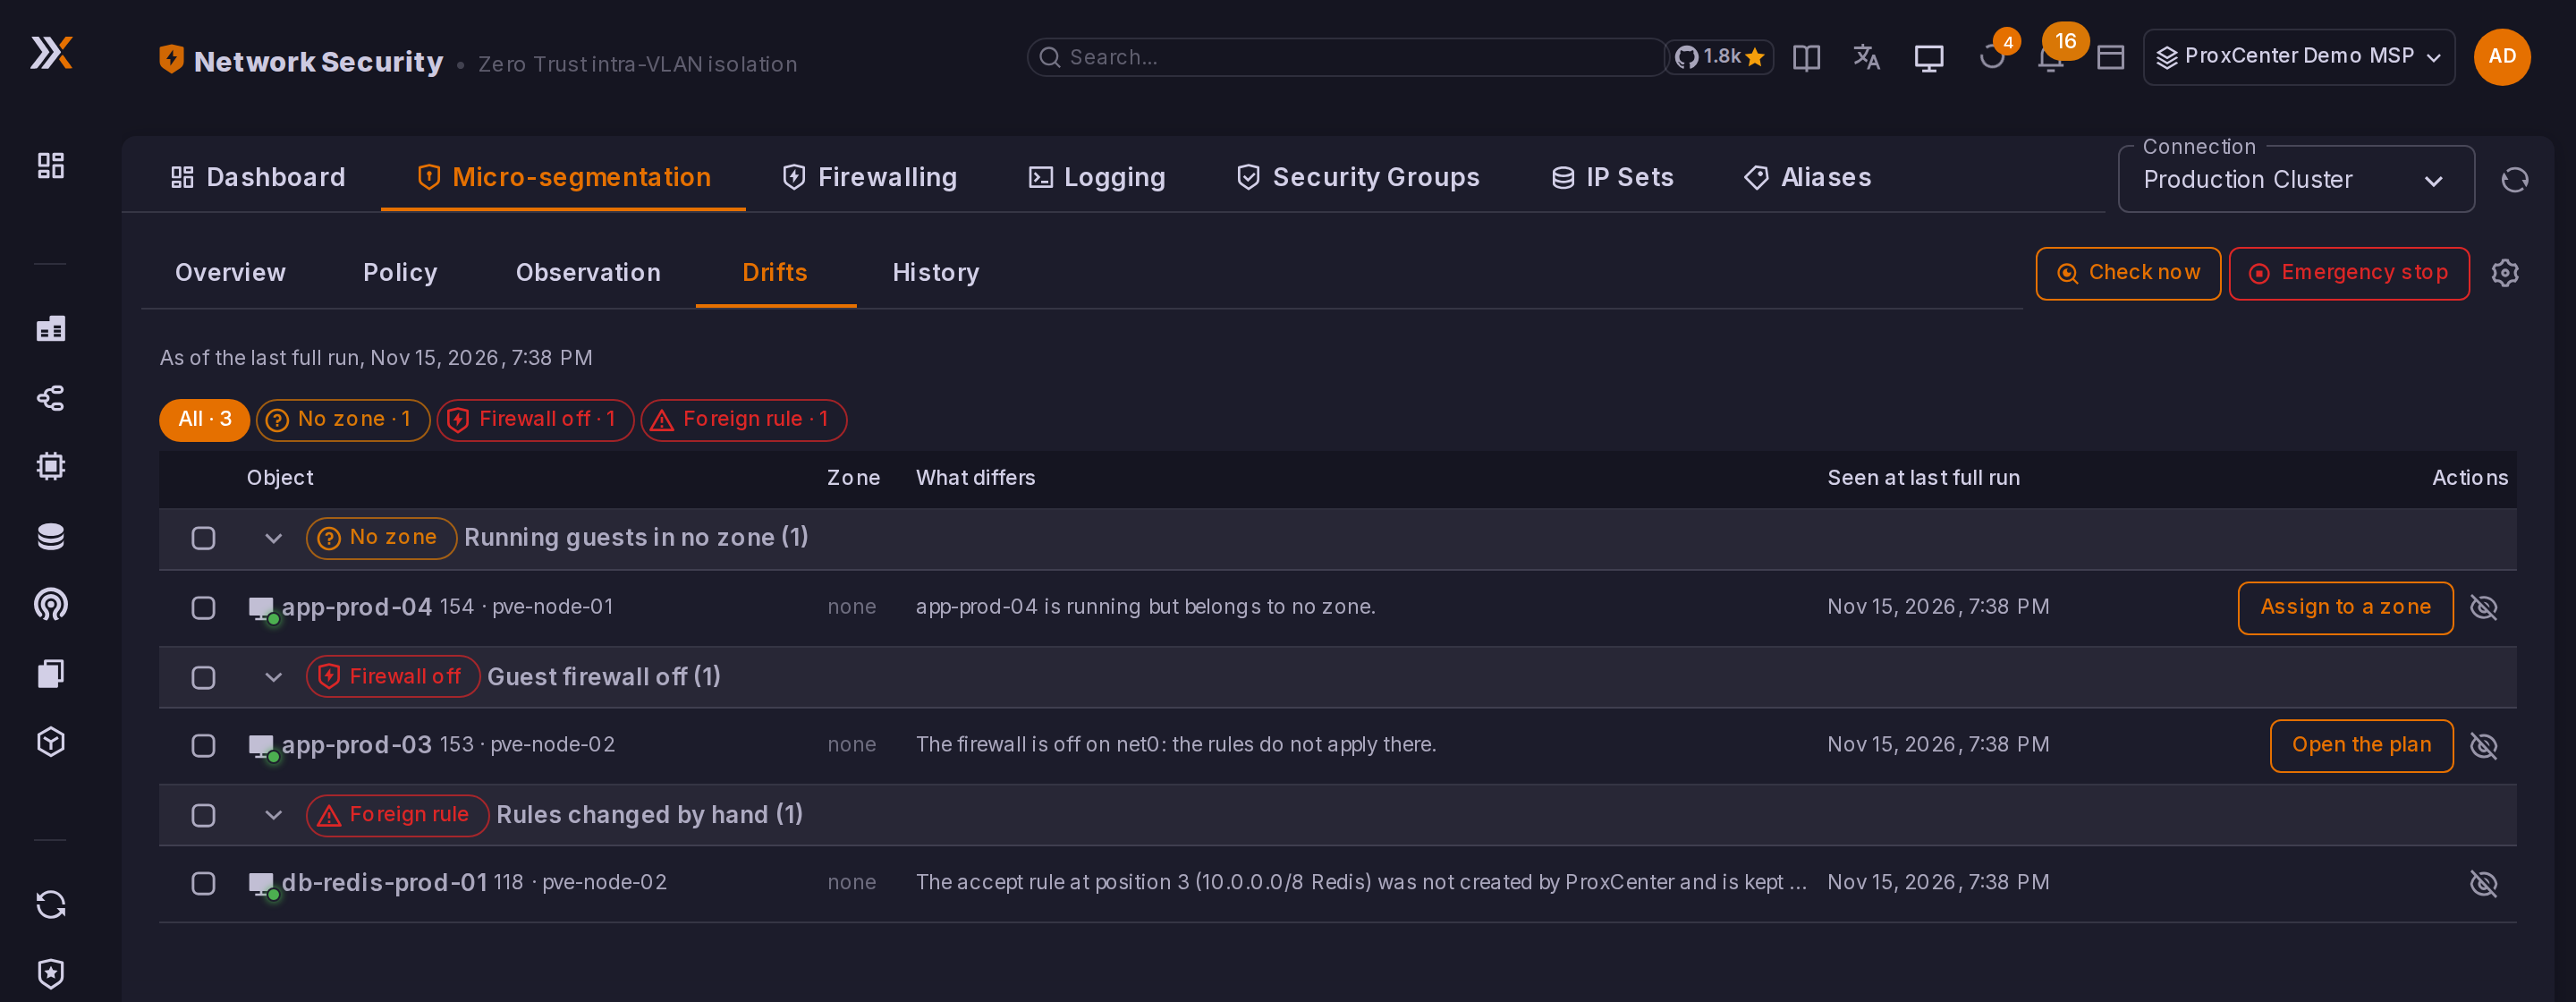
| Drift | Fix |
|---|---|
| Running guest without a zone | Assign to a zone, or Ignore. |
| Network card firewall off | Open the plan: the apply turns it back on. |
| Rule not managed by ProxCenter | An ACCEPT rule added outside micro-segmentation opens the guest or the group: review it in Proxmox. ProxCenter keeps it as it is. |
| IP set out of sync, Local network set out of sync | Repaired at the next pass. |
| Member without a known IP | Install the QEMU guest agent, or set an IP in cloud-init or in the container network. |
| Guest in several zones | Keep a single zone tag on the guest. |
| Name already used in Proxmox | Rename or delete the unmarked pcz-* object in Proxmox. |
| Outbound rule missing, misplaced or at the wrong verdict, Known destinations rule missing or in excess | Repaired at the next pass. |
| Outbound without a known subnet | Check the guest network configuration in Proxmox: an IP with its prefix length, or the QEMU guest agent. |
Ignored drifts are hidden behind Show ignored.
History
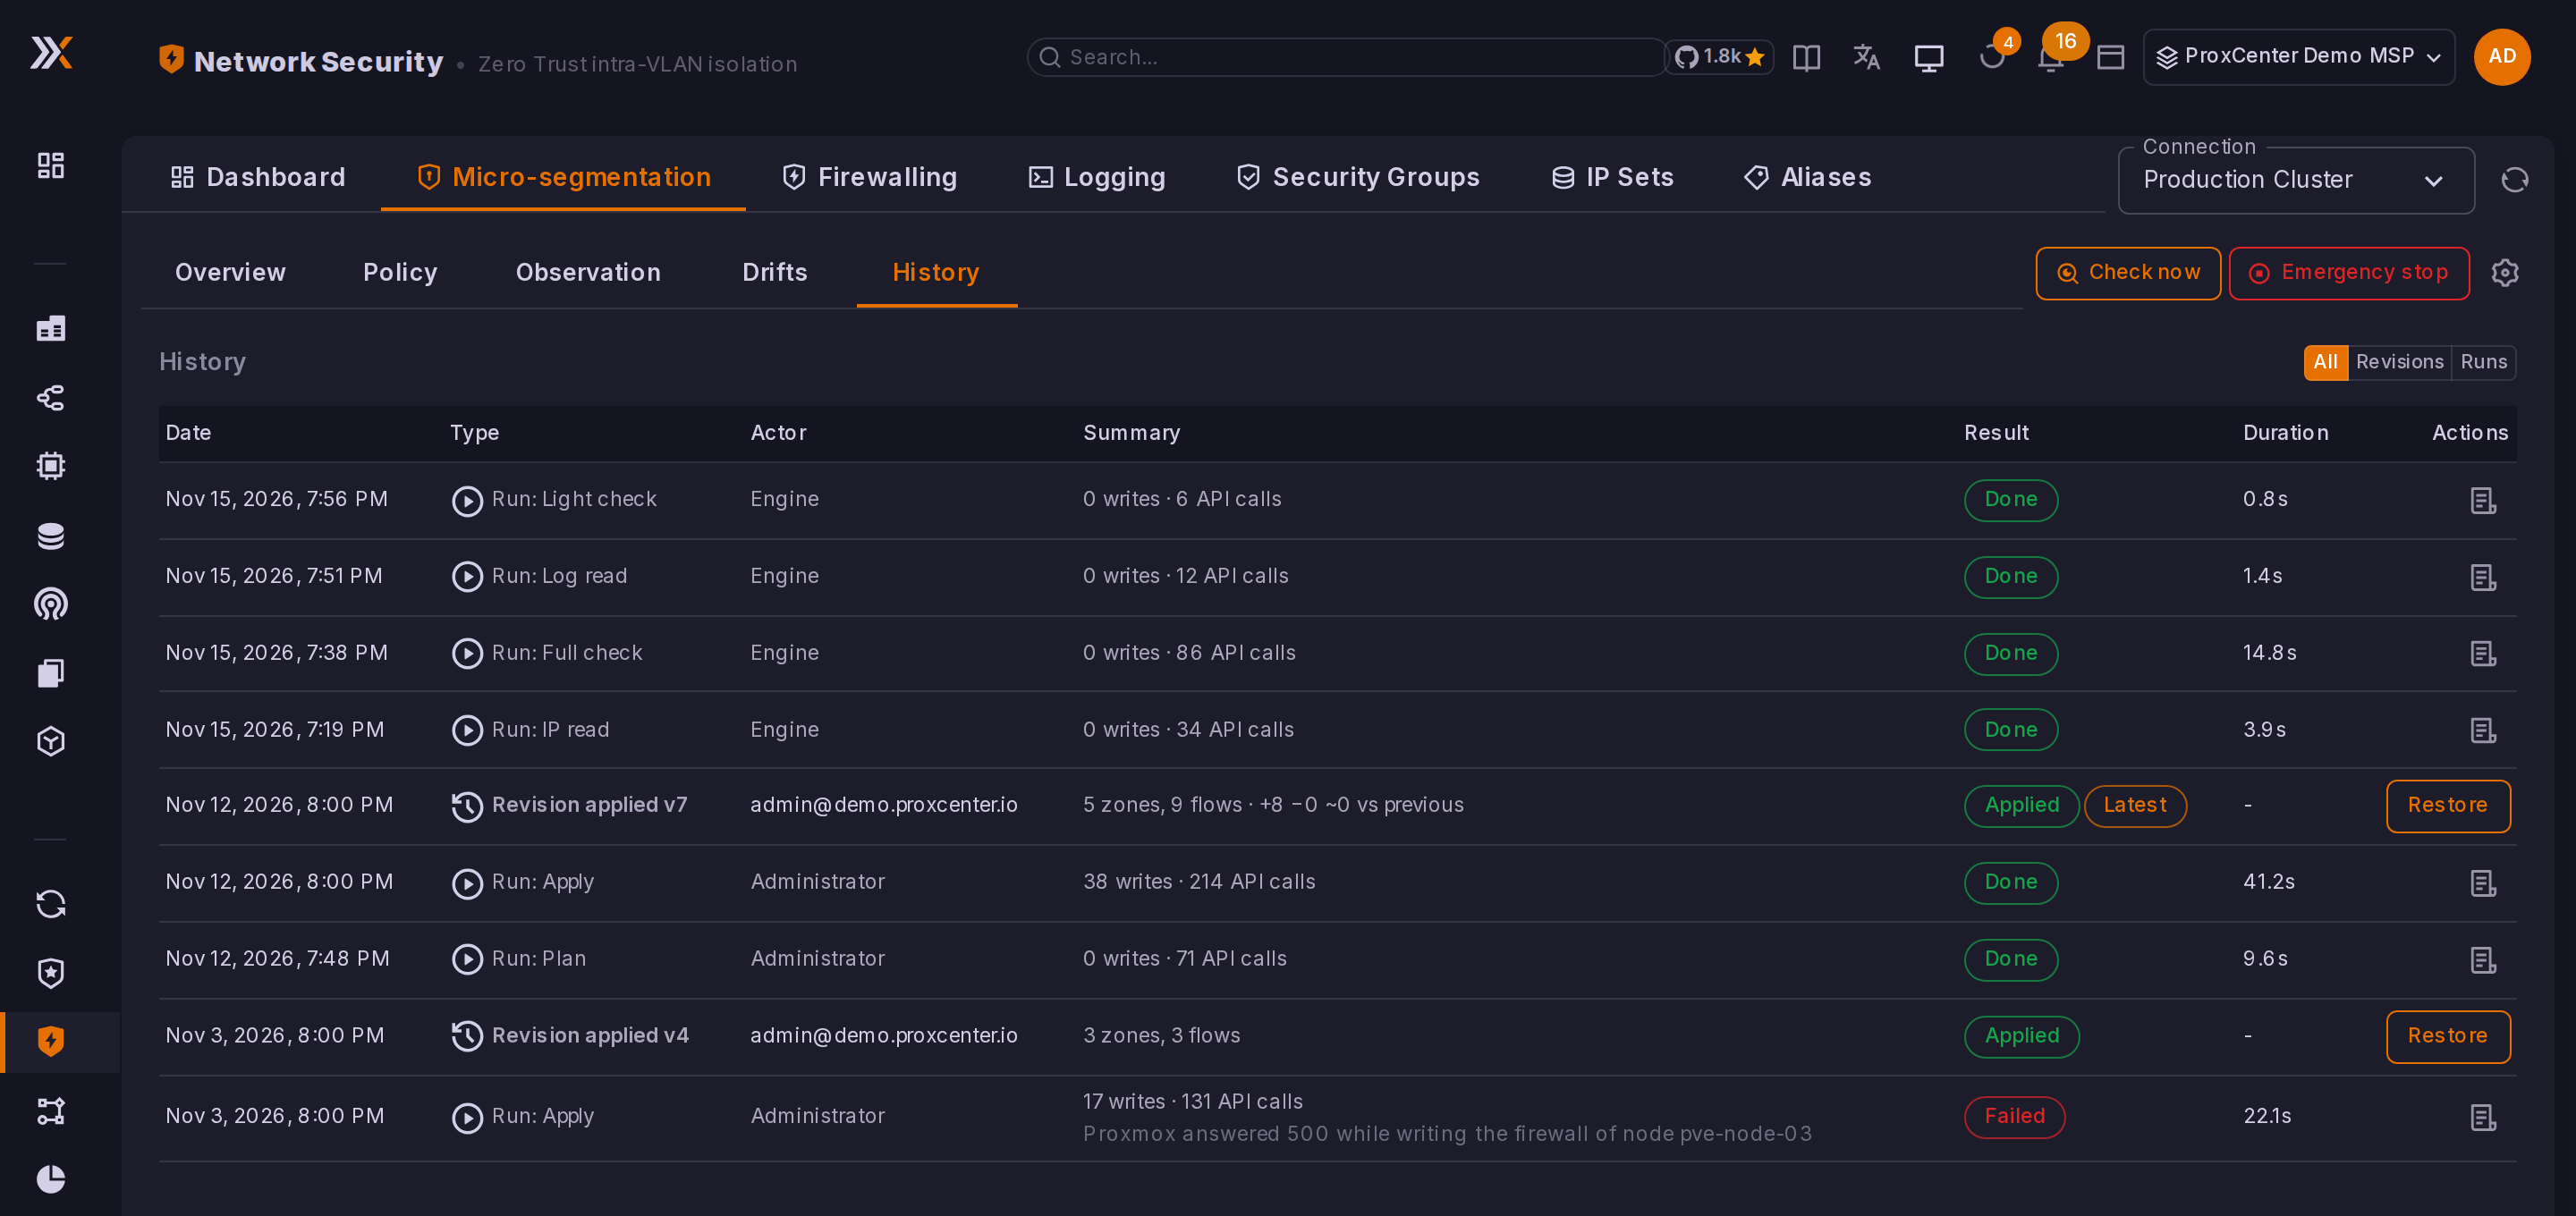
The History sub-tab lists the revisions and the engine runs, newest first, with their actor, summary, result and duration. Restore on a revision replaces the draft with that version and applies it to Proxmox. Each run opens its detail: API calls, writes, steps and errors.
Checks and load on Proxmox
The engine runs on the orchestrator, in four loops:
| Run | Default interval | What it reads |
|---|---|---|
| Light check | 300 s | The cluster IP sets, security groups and firewall options |
| IP read | 900 s | The IP addresses of the zone members, through the guest agent or the container interfaces |
| Full check | 1800 s | The firewall of every member, and the drifts |
| Log read | 60 s | The firewall log of each node, since the previous read, only while a zone observes or blocks |
The engine writes to Proxmox only when it finds a difference, one write after the other. Past the write cap per run (50 by default), it stops and holds the remaining writes until you confirm them in the banner. Check now queues a full check at the engine's next pass, within 60 seconds, and shows what it read, compared and repaired.
Emergency stop
Emergency stop is always visible on the tab. It disables the Proxmox cluster firewall with a single request, effective immediately on every node, and moves every zone of the connection to observation.
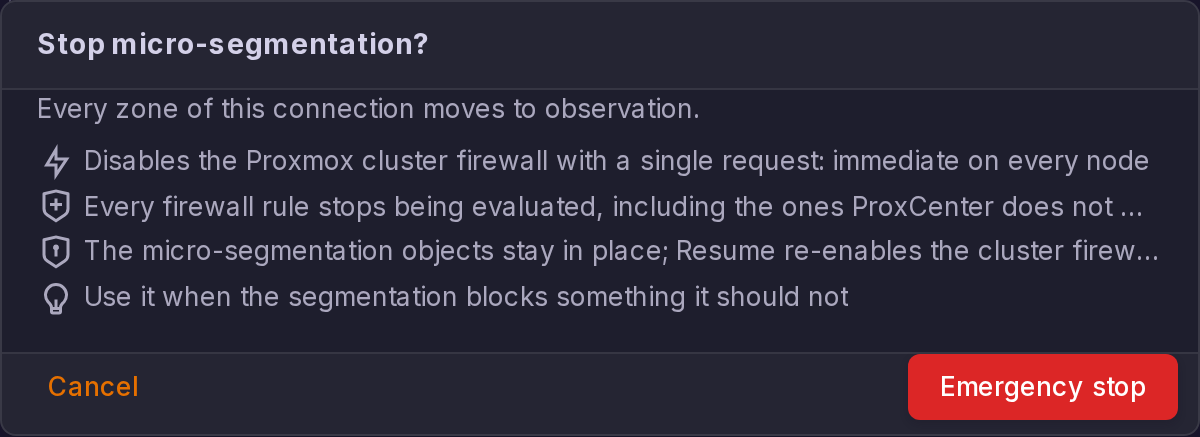
While the stop is active, every firewall rule of the cluster stops being evaluated, including the rules ProxCenter does not manage: management rules, host rules and guest rules. Use it when the segmentation blocks something it should not, then fix the policy and resume.
The micro-segmentation objects stay in place. Resume re-enables the cluster firewall and re-applies the last revision. It is refused while a node whose own firewall is on does not let the web UI (8006) and SSH (22) in from ProxCenter: allow them in that node's firewall, or turn it off, first.
Settings
The gear icon opens the micro-segmentation settings of the connection.
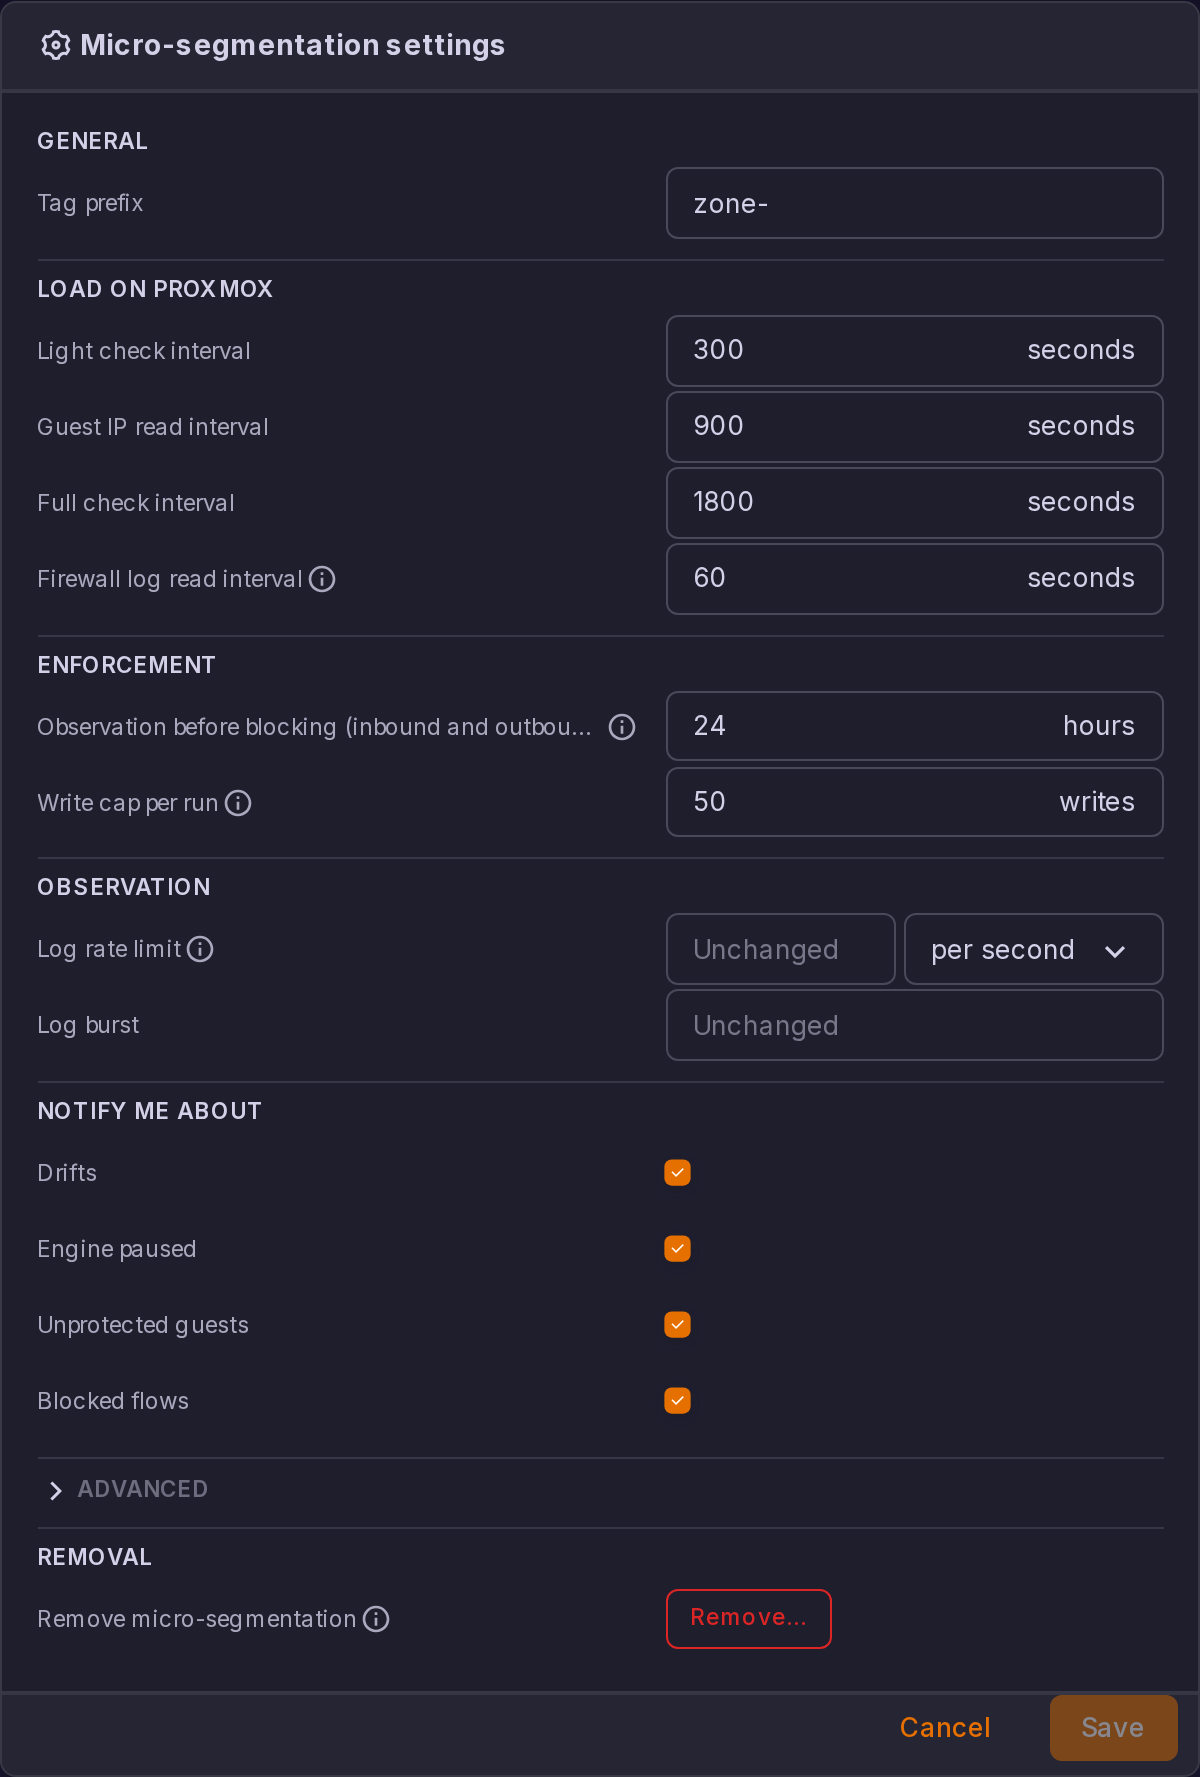
| Section | Settings |
|---|---|
| General | Tag prefix: 1 to 16 characters. Changing it makes guests tagged with the old prefix leave their zones at the next apply, until they are tagged again. |
| Load on Proxmox | The four loop intervals. |
| Enforcement | Observation before blocking (24 hours by default, inbound and outbound) and Write cap per run. |
| Observation | Log rate limit and Log burst: empty leaves the Proxmox values untouched; otherwise they are set while a zone is observed. |
| Notify me about | Drifts (each new drift, at most once an hour), Engine paused, Unprotected guests, Blocked flows. The notifications go to the channels of Settings > Notifications. |
| Advanced | Addresses Proxmox sees: the addresses ProxCenter reaches the nodes from. Leave empty to use the detection; the installers record the host addresses. |
| Removal | Remove micro-segmentation. |
Removing micro-segmentation
Remove… asks you to type the connection name, then releases every guest, deletes the objects ProxCenter created in Proxmox, and restores the log rate limit. The zone tags stay on the guests and the draft is kept, so you can apply it again later. If the removal reports incomplete, run it again.
Access
| Permission | Allows |
|---|---|
node.view on the connection | Read the policy, the map, the observation, the drifts and the history |
node.manage on the connection | Every change: draft, apply, state changes, emergency stop, restore, settings, removal |
Without node.manage, the controls stay visible but disabled. Every apply, state change, emergency stop, restore and removal is recorded in the audit log under the user who made it.
The public API does not expose micro-segmentation routes.