First Steps
With ProxCenter installed and your Proxmox infrastructure connected, here is a guided tour of the dashboard and its key sections.
The Home Dashboard
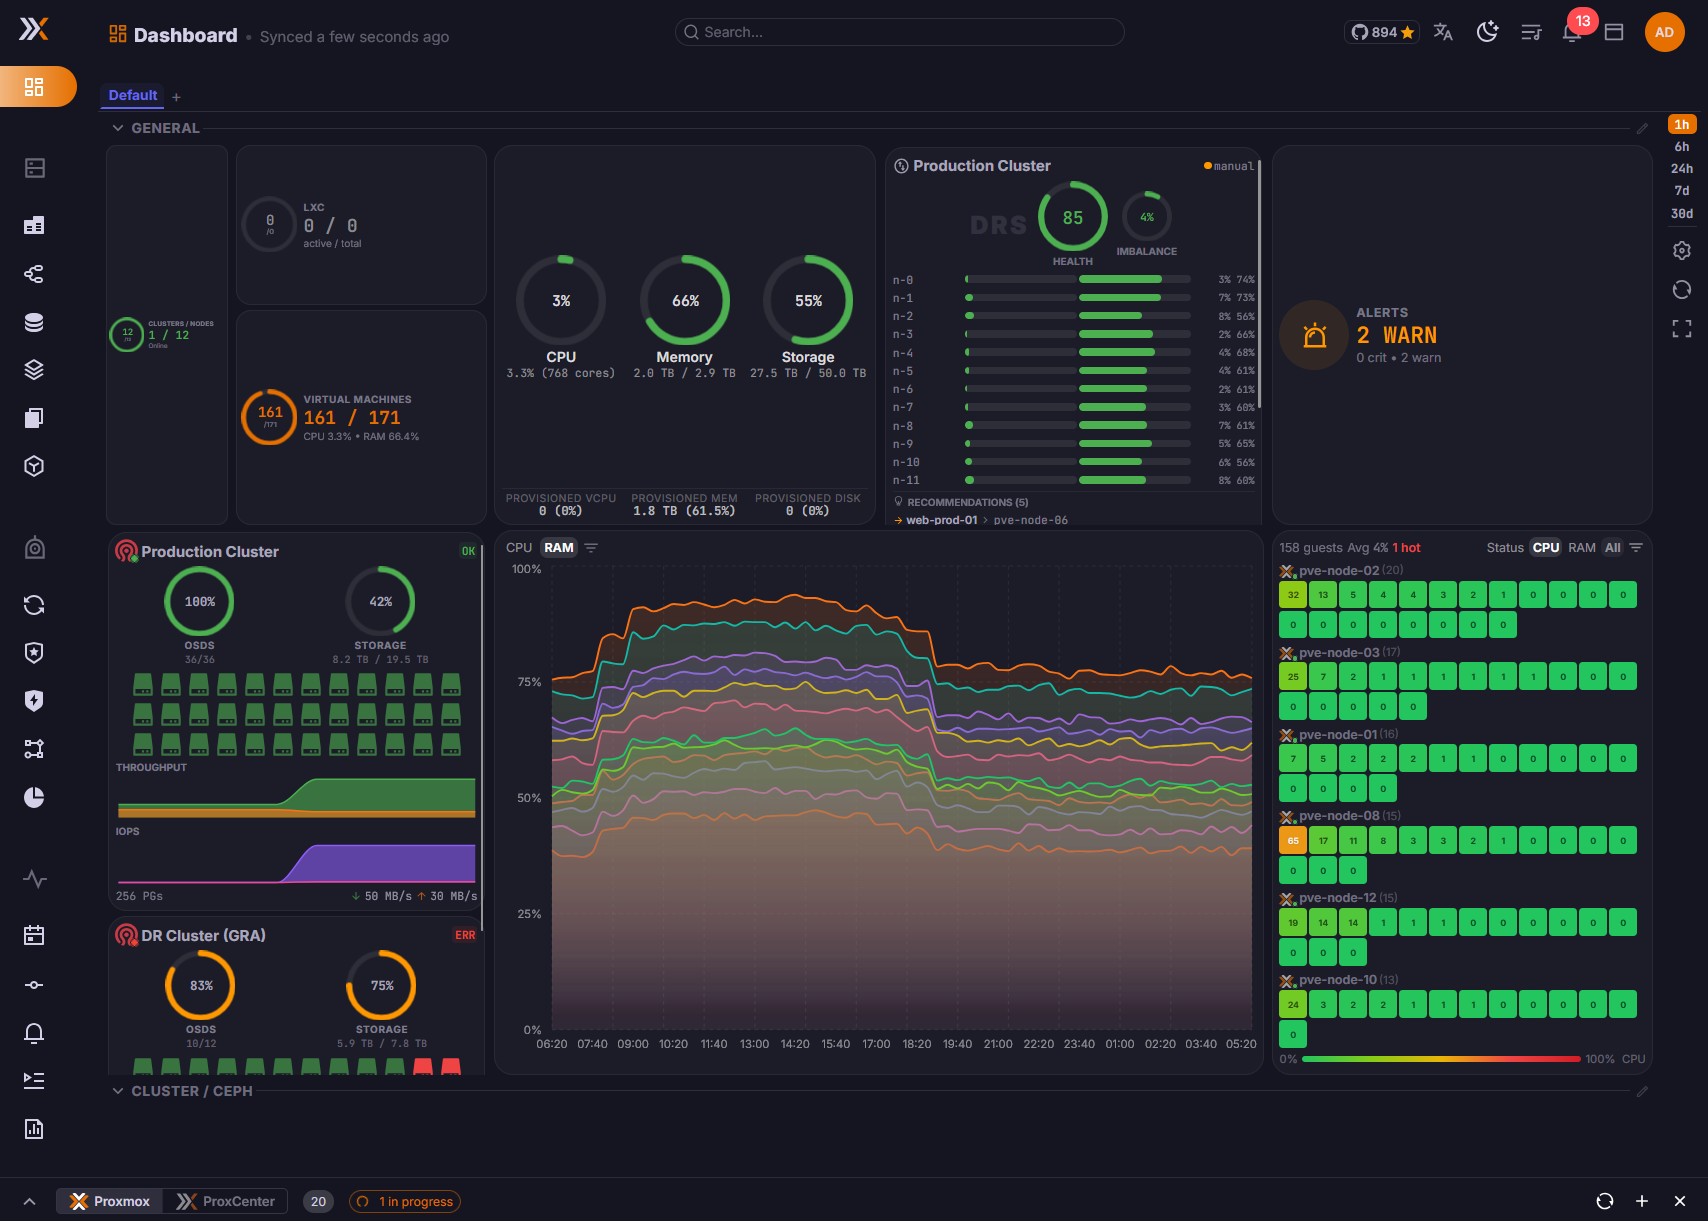
When you log in, the Home page gives you an at-a-glance overview of your entire infrastructure through a set of widgets:
- Cluster Summary -- Total number of connected clusters, nodes, VMs, and containers
- Resource Utilization -- Aggregate CPU, memory, and storage usage across all nodes
- Node Health -- Online/offline status for each connected Proxmox node with quick health indicators
- Recent Events -- The latest operations and system events from across your infrastructure
- Backup Status -- Overview of recent backup job results (success, warnings, failures)
- Tenant and vDC Overview (Enterprise) -- Tenant capacity, vDC consumption, and Green IT KPIs for MSP / IaaS deployments
The dashboard refreshes data in real time. You do not need to manually reload the page -- metrics and statuses update automatically as your infrastructure changes.
Arranging Your Dashboard
The Home page is a grid you arrange yourself, and it belongs to you: the layout is saved on your own account, so two administrators of the same installation can look at the same fleet through different dashboards. You can keep several named dashboards and switch between them.
- Click Customize in the toolbar on the right of the page. The button becomes Finish.
- Drag a widget by its handle to move it, or its corner to resize it.
- Click Add widget to open the widget library, browse the category tabs, and click a card to drop that widget in.
- Click Finish to leave arrangement mode.
A widget stays where you drop it. Nothing slides up to fill a gap behind it, so deliberate empty space is deliberate: you can leave a column open, group related widgets together, and find the same layout when you come back.
Moving Dashboards Between Installations
The dashboard menu carries Export all dashboards and Import dashboards. The export is one JSON file holding the whole set, and it fails rather than handing over a partial file.
An import is reconciled against what the target installation actually has, and reports what it kept:
- The connections, clusters and nodes a widget filters on are resolved against the target's own connections. What resolves is kept, what does not is dropped.
- A widget type the importing user may not use is dropped, so a file cannot hand someone a view their permissions do not allow.
- A dashboard left with no usable widget is skipped, and the result says so.
A file that is not a ProxCenter export, or one written by a newer version, is refused with that reason rather than partially applied. The import is confirmed against the stored list before it reports success, because an accepted request is not proof that anything was stored.
Two widgets added in v1.4.10
- Guests per Node, in the Infrastructure category -- a cluster, node and guest tree with live CPU and RAM on every level. Where the Guest Map shows one metric per tile and the name only on hover, this shows the name and both figures at once. Cluster rows carry the node count, the running and total guest counts, and a load aggregated from their nodes. It opens fully collapsed and remembers what you opened, and Expand all / Collapse all covers every level.
- Storage Latency, in the Resources category -- guest disk latency per storage, slowest first, with the read and write split, the average and maximum over the window, and the number of guests and disks behind each line. The bars take the colours of the guest disk latency thresholds when that alert is on, and stay neutral when it is off. (Enterprise)
Two widgets joined the library in v1.4.8:
- ZFS ARC, in the Resources category -- per-node ZFS ARC memory usage. ARC used to be visible only in the node summary, sharing an axis with total memory available, where it is squashed onto the baseline and tells you nothing. Here it gets an axis of its own that scales to the data, and a second reading as a share of node RAM: the ARC and % RAM chips at the top left of the widget switch between the two. Nodes that report no ARC are left out of the chart rather than drawn as flat lines.
- Theme Logo, in the Other category -- shows your branding logo if White Label sets one, the ProxCenter logo otherwise, and the badge of the active theme when neither applies.
The figure comes from the node's own metric history, in a field Proxmox only started recording in PVE 9. On an older Proxmox, or on a node that does not use ZFS, there is nothing to plot, and the widget says so: No ZFS ARC data. Requires PVE 9 or later on a node using ZFS. It is not a version test, it is the absence of the measurement itself, so a mixed fleet charts the PVE 9 nodes and quietly leaves the others out.
The widget needs a view of the hosts, so it is offered to administrators and to users holding a global, connection or node scoped grant. A tenant confined to a vDC does not see it, as it does not see the nodes it would describe.
Your Color Scheme and Layout
Light or dark mode, the accent color, the navigation layout, density, font size, interface scale and the refresh interval all live in Settings > Appearance, and they are saved automatically as you change them.
Since v1.4.8 they are stored on your account rather than in a browser cookie, per user and per tenant. Two consequences in daily use:
- Your appearance follows you to another browser or another machine, and a browser that clears cookies on exit no longer resets it.
- It is resolved on the server before the page is sent, so the interface arrives already in your palette rather than flashing the default one first.
A preference set before the upgrade is imported once, and only into the account that set it: the import carries the id of the account that wrote the cookie, so on a shared workstation one person's look is never copied onto the next person who signs in.
The theme dropdown in the navigation bar changes the mode and the accent color directly, and writes to the same place.
Navigating the Sidebar
The sidebar organizes ProxCenter's features into logical sections. Here is what each one covers.
Infrastructure
Your central inventory for all connected Proxmox resources.
- Inventory -- A unified table of all nodes, virtual machines, and containers across every connected cluster. Filter, search, and sort by any attribute. Click any resource to view detailed information, metrics, and available actions.
- Virtual Datacenters (Enterprise) -- Configure tenant vDCs with quotas, placement boundaries, SDN networks, IPAM, and per-vDC backup isolation.
- Storage -- Overview of all storage pools (local, shared, Ceph, NFS, ZFS) with capacity and usage metrics.
- Ceph -- Dedicated view for Ceph cluster health, OSD status, pool configuration, and performance metrics (if your Proxmox environment uses Ceph).
- Datacenters & Green IT -- Configure physical datacenter factors such as PUE, electricity price, CO2 factor, and server specs for VM and vDC energy reporting.
Operations
Day-to-day management and monitoring tools.
- Events -- Aggregated event log from connected Proxmox hosts, filtered automatically by tenant scope when multi-tenancy is enabled.
- Backups -- Centralized backup management across PVE and PBS, including per-vDC PBS namespaces, tenant restore, and tenant-scoped backup jobs.
- Alerts (Enterprise) -- Configure threshold-based and event-based alerts. In tenant mode, alerts are scoped to the tenant's visible resources.
- Jobs (Enterprise) -- Track recurring tasks, maintenance operations, migrations, backup orchestration, and tenant-visible jobs from the orchestrator.
- Reports (Enterprise) -- Generate infrastructure, tenant, and vDC reports covering resource usage, capacity planning, Green IT, and operational summaries.
Automation
Advanced orchestration features for optimizing and protecting your environment.
- DRS (Enterprise) -- Distributed Resource Scheduling automatically balances VM workloads across nodes in a cluster based on CPU and memory utilization thresholds.
- Site Recovery (Enterprise) -- Configure disaster recovery plans with automated failover between Proxmox clusters. Define recovery priorities and test failover procedures.
- Network Security (Enterprise) -- Manage network security policies and firewall rules across your Proxmox infrastructure from a centralized interface.
Security
Access control and compliance features.
- Users -- Manage ProxCenter users and view Proxmox user accounts across connected hosts.
- RBAC (Enterprise) -- Role-Based Access Control with granular permissions. Define custom roles and assign them to users or groups with tenant and resource-level scoping.
- Audit Log (Enterprise) -- Comprehensive audit trail of all actions performed through ProxCenter. Track who did what, when, and on which resource.
Settings
Platform configuration and account management.
- Appearance -- Color scheme, accent color, navigation layout, density, font size and data refresh interval. Saved on your own account, so this is the one tab every user gets.
- License -- View your current edition (Community or Enterprise), activate a license key, and check feature availability.
- API -- Read-only API tokens for external monitoring and reporting tools. Needs the ProxCenter API Access add-on on top of an Enterprise license, see API Tokens.
- Connections -- Manage your Proxmox VE and PBS connections (add, edit, remove, test).
- Notifications (Enterprise) -- Configure notification channels (email, webhook, Slack, Telegram) for alerts and reports.
- LDAP (Enterprise) -- Connect ProxCenter to your LDAP or Active Directory server for centralized user authentication.
- Multi-Tenancy (Enterprise) -- Manage tenants and their lifecycle, assign whole clusters to MSP tenants or vDCs to IaaS tenants, and review cross-tenant users.
- White Label (Enterprise) -- Customize the application identity, email branding, and login page for customer-facing environments.
Features marked (Enterprise) require an active Enterprise license. In the Community edition, Enterprise-only sections are hidden or display an upgrade prompt depending on context.
Tips for Getting Started
- Check your connections -- Head to Infrastructure and verify all your Proxmox nodes show as online with a green status indicator.
- Explore the inventory -- Click through your nodes, VMs, and containers to see detailed metrics and available actions.
- Review your backups -- Go to Operations > Backups to confirm your backup jobs are running as expected.
- Set up additional users -- If your team needs access, create user accounts under Security & Access > Users.
- Set up tenants -- Create tenants, then either assign whole clusters to MSP tenants or vDCs to IaaS tenants, configure quotas, bind PBS namespaces, and verify tenant isolation.
- Activate your license -- If you have an Enterprise license key, enter it in Settings > License to unlock advanced features.
What's Next?
Dive deeper into each feature area:
- Infrastructure -- Inventory -- Detailed guide to the unified resource inventory
- Infrastructure -- Virtual Datacenters -- Tenant vDCs, quotas, IPAM, and backup isolation
- Infrastructure -- Datacenters & Green IT -- Datacenter factors and VM Green Scores
- Infrastructure -- Storage -- Managing storage pools and monitoring capacity
- Operations -- Backups -- Backup management and PBS integration
- Operations -- Events -- Working with the aggregated event log
- Automation -- DRS -- Configuring Distributed Resource Scheduling
- Security -- RBAC -- Setting up role-based access control