Alerts
The Alerts page itself requires an Enterprise license: on a Community install it shows an upgrade prompt instead of the dashboard, because the alerts are produced by the ProxCenter orchestrator, which is an Enterprise component.
Threshold configuration lives elsewhere, in Settings > Alert thresholds, and is reachable in the Community edition too. There, the CPU, memory and storage levels colour the dashboard gauges without any orchestrator; the other thresholds on that screen are only consumed by the orchestrator and therefore only do something on Enterprise.
The Alerts page provides a real-time alert dashboard for monitoring resource utilization and event-based anomalies across your Proxmox infrastructure. Alerts are processed by the ProxCenter orchestrator and displayed with configurable thresholds and rules.
In multi-tenant environments, alert visibility follows tenant and vDC scope. Provider administrators can monitor all tenants, while tenant users only see alerts for their own resources.
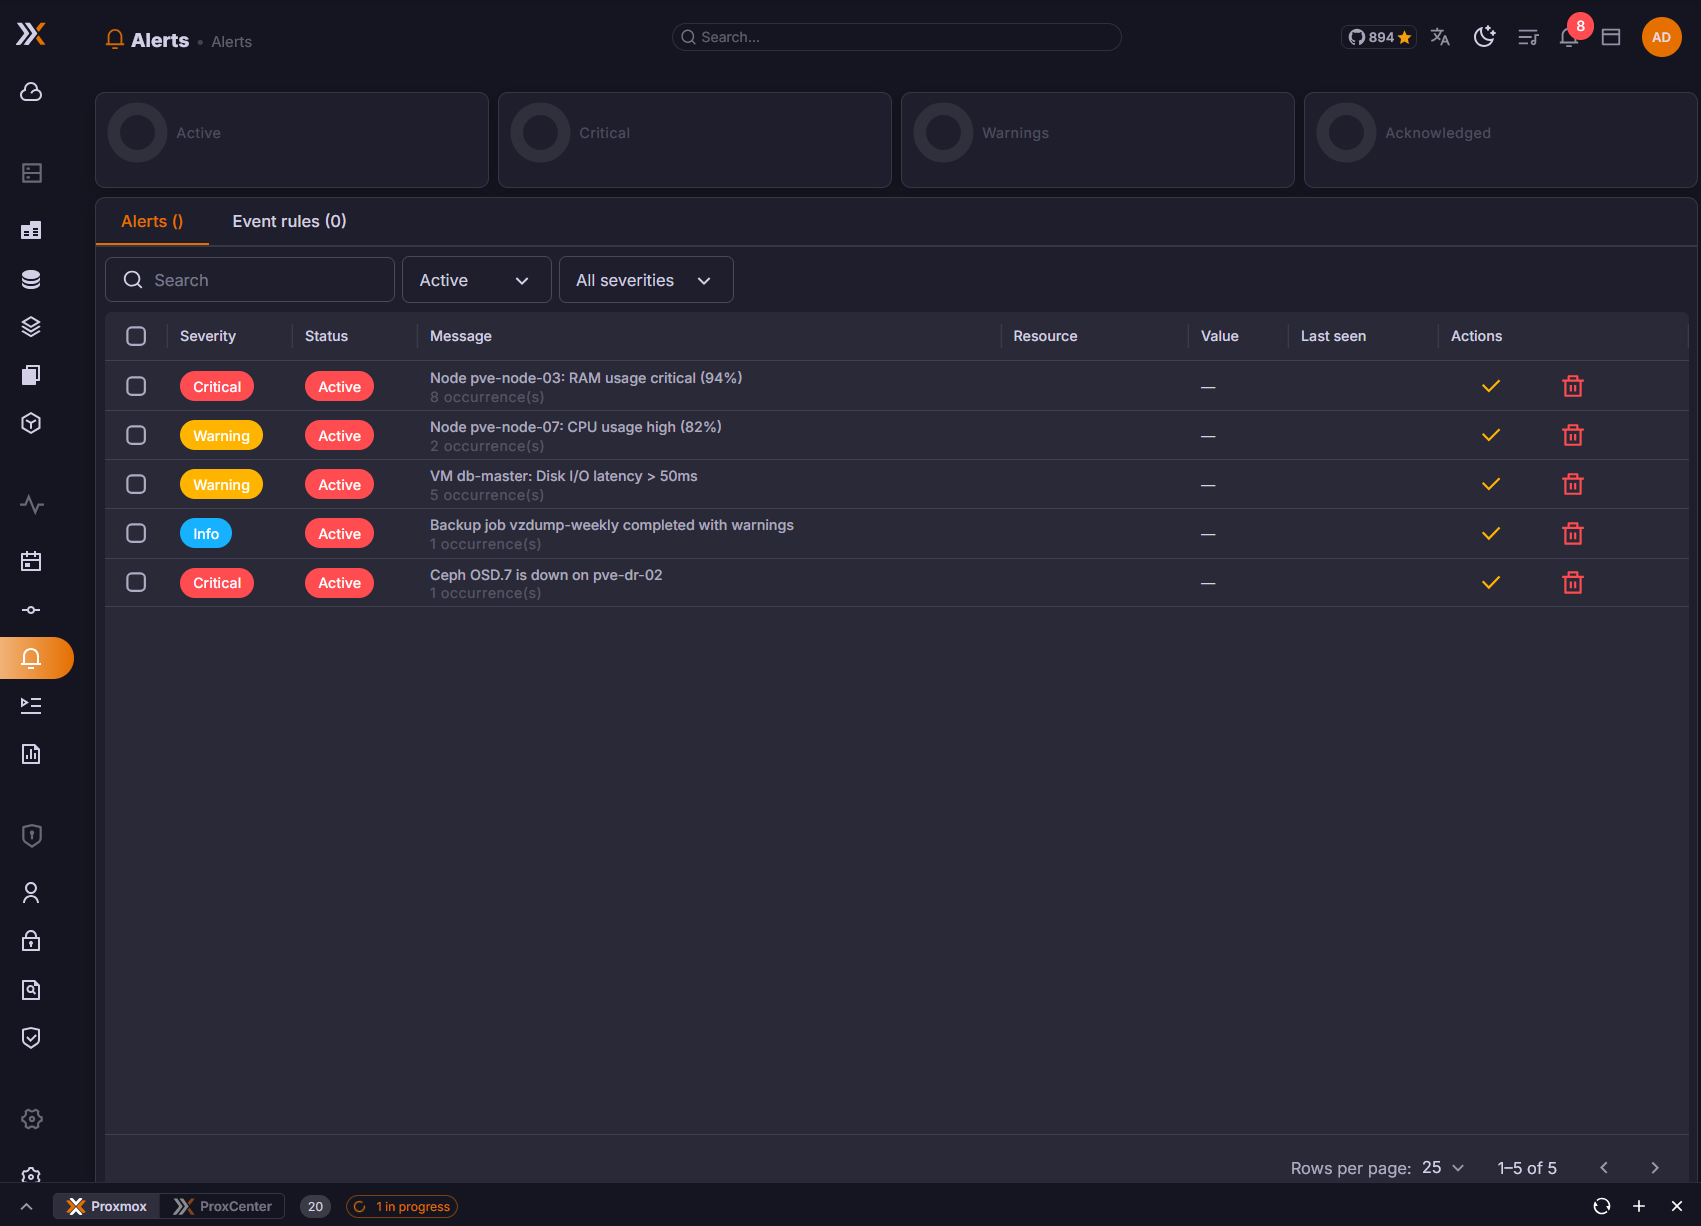
Overview
The Alerts page carries two tabs, under a row of four summary cards:
- Alerts -- View and manage the alerts the orchestrator has raised
- Event rules -- Create custom rules that trigger alerts based on Proxmox events
The levels that decide when an alert is raised are not on this page. They live in Settings > Alert thresholds, described in Thresholds below.
Alert Dashboard
Summary Statistics
Four stat cards at the top provide a quick overview:
| Stat | Description |
|---|---|
| Active Alerts | Total number of currently active (unresolved) alerts |
| Critical | Number of alerts with critical severity |
| Warnings | Number of alerts with warning severity |
| Acknowledged | Number of alerts that have been acknowledged but not yet resolved |
Alert List
The alert data grid displays all alerts with the following columns:
| Column | Description |
|---|---|
| Severity | Info, Warning, or Critical |
| Status | Active, Acknowledged, Resolved, or Muted |
| Message | Alert description with occurrence count |
| Resource | The affected resource, with the connection it belongs to underneath. A guest alert reads name (resource); a Ceph OSD alert reads the node name followed by the OSD, for example pve3 (osd.4); a storage-wide disk latency alert reads the storage id; a replication alert reads the job name followed by its identifier |
| Value | Current metric value with its unit: % for CPU, memory and storage, ms for OSD latency and guest disk latency, min for an RPO drift, days for a stale snapshot. An alert with nothing to measure shows a dash |
| Last Seen | When the alert was last detected |
| Actions | Depends on the status, see below |
Filtering Alerts
You can filter the alert list by:
- Search -- Free text search across alert messages and resource names
- Status -- Active, Acknowledged, Resolved, Muted, or All
- Severity -- Critical, Warning, Info, or All
Managing Alerts
The actions offered on a row follow its status:
| Status | Actions |
|---|---|
| Active | Acknowledge, Mute this alert, Delete |
| Acknowledged | Mute this alert, Delete |
| Muted | Unmute this alert, Delete, plus a chip stating when the mute expires, or an infinity sign when it does not |
| Resolved | Delete |
- Acknowledge marks an alert as seen without ending it. Use it to say that somebody is on it.
- Mute silences an alert signature so the same condition stops being raised, for 1 hour, 6 hours, 24 hours, 7 days, or indefinitely. It acts on the signature, not on the single row, so the alert does not come straight back at the next collection.
- Delete removes the row from the table.
Ticking several rows adds Acknowledge selected and Delete selected above the grid.
There is no per-row Resolve action. An alert ends when the condition that raised it goes away and the orchestrator confirms it, which is what Alert Recovery below describes. Acknowledging or muting an alert changes nothing about the underlying condition: if CPU usage is still above the critical threshold, the alert is still there.
Thresholds
Thresholds are configured in Settings > Alert thresholds, not on the Alerts page. The tab is visible to a super administrator in the provider view; it does not appear inside a tenant context.
The tab is split into four sub-tabs, one per family: Resource Usage (CPU, memory, storage), Performance & replication (Ceph OSD latency, guest disk latency, replication RPO and failures), Snapshots (stale snapshots and their exclude pattern) and Collection & recovery (the collection interval and the recovery hysteresis). The Save button above them saves every family at once, whichever sub-tab is showing.
Each setting is a card. Cards that can be switched off carry a switch in their corner and read Disabled in place of their slider when they are off. A single Save button at the top of the screen commits the whole screen at once.
Saving writes the values to the ProxCenter database and then hands them to the orchestrator, which applies them immediately and stores its own copy so they survive a restart. That hand-off is best effort: if the orchestrator happens to be down when you save, ProxCenter keeps your values but the engine keeps evaluating with the ones it already had. Save the screen again once the orchestrator is back.
Resource Usage
Three cards, each a two-handle slider carrying a warning and a critical level, in percent.
| Card | Warning | Critical |
|---|---|---|
| CPU | 80% | 90% |
| Memory | 80% | 90% |
| Storage | 80% | 90% |
These three are also the levels that colour the dashboard gauges, which is why this screen is reachable on a Community install even though the Alerts page is not.
Set your warning thresholds low enough to give you time to react before a resource becomes critically exhausted. For storage, consider setting warning at 75% if your storage grows rapidly.
Metrics Collection
One card, Collection interval, on the Collection & recovery sub-tab next to the recovery hysteresis: a slider setting the time between two metrics collections of the orchestrator, 60 seconds by default, from 30 seconds to 10 minutes in 30-second steps. The bounds are the slider itself: a shorter cadence would have the collections of a large fleet overlap, a longer one would stretch the recovery confirmations to tens of minutes. Every figure the orchestrator gathers follows it, CPU, memory and disk of each node and running guest, the guest disk latency, so it is also the step at which the resource alerts are evaluated and the unit in which the recovery confirmations below are counted; the caption under the field spells out the resulting calm, three minutes at the default cadence with three confirmations. Saving applies the new cadence to the running orchestrator without a restart. The scheduler.metrics_interval key of config.yaml is only the starting value, used until the card is saved once.
Performance and Replication
Four cards on the Performance & replication sub-tab, three of them added in v1.4.8 and the guest disk latency in v1.4.10. Until v1.4.8 a threshold could only describe how full a resource was; these describe how slow it is, and whether a disaster recovery job is keeping its promise.
| Card | Ships as | What it measures |
|---|---|---|
| Ceph OSD latency | Off | The latency of each Ceph OSD, in milliseconds. Two handles, warning and critical, from 10 ms upwards. Switching the card on pre-fills 100 ms warning and keeps the critical level at 250 ms or above |
| Guest disk latency | Off, 5 min window | The service time per I/O of every virtual disk, in milliseconds, as the guest experiences it, averaged over the window set on the card. Two handles from 1 ms upwards; switching the card on pre-fills 30 ms warning and 100 ms critical. Judged per storage first, then per guest, see Guest Disk Latency |
| Replication RPO | On, 25% | How far a replication job's last successful sync may fall behind that job's own RPO target before it is considered late. A single handle, in percent, from 5% |
| Replication failures | On | On or off only, nothing to tune: alert when a replication job errors out, or completes with some of its VMs in error. Escalates from warning to critical once the retries of a failed job are spent; a partially synced job stays a warning |
No latency figure is right for every disk: an OSD on a mechanical drive lives at 150 ms while an NVMe lives at 1 ms, so any default we picked would be wrong somewhere, and an upgrade that starts mailing on its own is not a service. Switch the card on and set the pair that matches your hardware, ideally after watching your own numbers for a while.
The reading is the worse of the OSD's apply and commit latency. An OSD that is down, or that an operator has taken out, is left out of the measurement rather than read as zero: a fallen OSD has not become fast, it has disappeared, and its alert stays active until it can be measured again. An OSD that vanishes from the CRUSH tree altogether has its alert resolved.
Guest Disk Latency
Proxmox reports how many bytes a guest reads and writes, not how long each I/O takes. QEMU does keep that figure, per virtual disk, in its block statistics: the number of operations and their total service time since the guest started. The orchestrator reads them at every metrics collection for each running QEMU guest and derives the average latency of the interval from the difference between two readings. That is the latency the guest actually felt, storage stack included, which is why an alert on it tells you something before users do. Containers have no QEMU process and therefore no figure.
Where the figures show up:
- Inventory, VM list: a Latency column with the worst disk of each guest at the last collection; hovering it lists every disk with its read and write latency and its maximum over the window. The column appears once a cluster reports a latency and can be hidden from the column picker.
- Inventory, guest summary: the Disk I/O chart carries one latency curve per virtual disk on a right-hand axis in milliseconds, over the same range and at the same resolution as the bandwidth areas, so a latency spike can be read against the throughput that caused it. The orchestrator stores the history as one point per disk every 5 minutes, so on the hour view the curve joins one point in five while the bandwidth areas keep their minute resolution; it keeps the history for the number of days set on the card, 7 by default.
- Storage overview: a Latency column per storage, aggregated over every guest disk it backs, with the number of guests and the window maximum in its tooltip.
How the alert judges:
- Storages first. A storage backing at least two running guests is judged as a whole, on the average of every disk it backs weighted by operations. When that average stays above the warning level for the whole window, one alert is raised on the storage, and the guests on it raise none: thirty VMs slow because their array is slow are one incident, not thirty.
- Then guests. A guest whose worst disk stays above the level for the whole window, on a storage that is not itself alerting, gets its own alert naming the disk and the storage. That is the guest-specific case, a noisy neighbour or a runaway job.
- Only a full window is judged. Nothing is raised, and nothing is resolved, on an average that does not yet cover the window. With the default 5 minutes and a collection a minute, a guest needs five readings after it starts before it can alert.
- Sweeps. A guest that stops or is destroyed has its alert resolved at once; a storage that drops under two guests has its storage-wide alert resolved, and the remaining guest is judged on its own at the next pass.
The window is shared: the average the alert compares is the one the interface shows as Average (n min), and the Max (n min) next to it is the worst single collection in that window, the figure to hold against a user's "the disk froze around 10:42".
No latency figure fits every disk. A local NVMe answers in 0.2 ms, a healthy Ceph pool on SSDs in 2 to 5 ms, a replicated pool on mechanical disks in 20 ms. Watch your own numbers in the inventory for a day, then switch the card on with a warning level above what your busiest hour shows.
The foot of the Guest disk latency card carries two settings that outlive the alert switch, because the figures feed the charts and lists whether or not anything alerts: the collection switch, on by default, which is what makes the orchestrator read the block statistics of every running VM at each collection (one API call per VM), and the history retention in days, 7 by default, up to 365. The history costs one row per disk every 5 minutes, about 40 MB a week per hundred disks. Switching the collection off empties the columns and curves at the next collection and resolves any latency alert; a very large estate can use it to spare the API calls. The orchestrator's config.yaml (scheduler.disk_latency_enabled, scheduler.disk_latency_retention_days) only provides the starting values. (Enterprise)
Why the RPO tolerance is a percentage. It is a share of each job's own target, not a fixed delay, because a fixed delay cannot fit both ends of the fleet: ten minutes late is meaningless against a 24 hour target and unacceptable against a 15 minute one. With the default 25%, a job targeting 15 minutes warns at 18 minutes 45 seconds without a successful sync, and turns critical at twice that. Some grace is unavoidable: a job that runs exactly on time mechanically reaches its RPO just before each run, so a zero margin would make every healthy job alert. Setting the card to off disables the RPO alerts entirely. The full behaviour is described in Site Recovery.
Maintenance
| Card | Ships as | What it does |
|---|---|---|
| Stale Snapshots | On, 7 days, nothing excluded | Alerts on a VM snapshot older than this, warning past the threshold and critical past twice it. Templates and LXC containers are skipped. The Exclude pattern underneath is a regex matched against the VM name and the snapshot name: whatever matches is left out of the check, and an alert already raised on it is resolved at the next pass. (?i)replica skips Veeam replicas, whose VeeamRP-... restore points are snapshots the operator is not meant to touch. RE2 syntax, so (?i) for case-insensitive and no lookahead; an invalid pattern is refused when you save |
| Alert recovery | 5 points, 3 checks | The hysteresis applied before an alert is declared resolved, described below |
Only the CPU, memory and storage levels are consumed by the frontend, to colour the dashboard. Every other card on the screen is read by the orchestrator, so on a Community install those cards can be set but nothing evaluates them. (Enterprise)
Event Rules
Event rules allow you to create custom alert triggers based on Proxmox task and log events. This provides granular control over what generates an alert.
Event-based rules and alert notifications require an Enterprise license.
Creating a Rule
Click the Add button to open the rule creation dialog. Configure the following fields:
| Field | Description |
|---|---|
| Name | A descriptive name for the rule (required) |
| Description | Optional explanation of what the rule monitors |
| Category | Filter by event category: All, Tasks only, or Logs only |
| Event Level | Filter by event severity: All, Error, Warning, or Info |
| Task Types | Comma-separated list of task types to match (leave empty for all) |
| Pattern | Optional regex pattern to match against event messages |
| Alert Severity | The severity of the generated alert: Info, Warning, or Critical |
| Email Notification | Whether to send an email when this rule triggers |
| Active | Enable or disable the rule |
Managing Rules
The rules data grid shows all configured rules with their current state. For each rule you can:
- Toggle the rule on/off with the switch in the first column
- Edit the rule to modify any field
- Delete the rule with confirmation
Rule Examples
- Monitor all error-level tasks: Set Category to "Tasks", Event Level to "Error", Alert Severity to "Critical"
- Watch for backup failures: Set Category to "Tasks", Task Types to "vzdump", Event Level to "Error"
- Pattern-based monitoring: Set Pattern to
WARNINGS:to catch tasks that complete with warnings
Alert Lifecycle
- The orchestrator evaluates each family on its own schedule, listed below
- When a condition is met, an alert is created with status Active and, for everything except event-rule alerts, a notification is sent
- If the same condition is still met at the next check, the existing alert's occurrence count increments and its Last Seen timestamp updates. No second mail is sent: only the creation of an alert notifies
- An operator can Acknowledge the alert to indicate awareness, or Mute its signature
- The alert is Resolved when the condition has cleared and stayed clear, at which point a recovery notification is sent
Evaluation Cadence
| Family | How often |
|---|---|
| CPU, memory, storage, node down | Every metrics collection: the Collection interval card of the Collection & recovery sub-tab, 60 seconds by default, 30 seconds to 10 minutes; scheduler.metrics_interval in config.yaml is only its starting value |
| Ceph OSD latency | Every minute |
| Guest disk latency | Every metrics collection, judged on a full window, 5 minutes by default |
| Replication RPO and replication failures | Every minute |
| Event rules | Every event poll, scheduler.event_poll_interval, 30 seconds by default |
| Stale snapshots | Every 6 hours, plus one pass shortly after the orchestrator starts |
The Ceph and replication checks deliberately run to the minute rather than to the hour, because the recovery hysteresis below counts checks, not elapsed time. At a slower cadence, three confirmations would take hours.
The same arithmetic applies to the collection interval: the recovery confirmations of the resource alerts count collections, so three confirmations mean three minutes of calm at the default cadence and fifteen at a five-minute one. The card says so under its field. A change is applied to the running orchestrator when the thresholds are saved, without a restart; each collection is one status call per node plus, when the guest disk latency collection is on, one per running QEMU guest.
Alert Recovery and Hysteresis
An alert used to end the first time its value dipped back under the threshold, and ended silently. Both halves changed in v1.4.8.
Hysteresis Before Resolving
A value that oscillates around its threshold used to raise and resolve an alert at every collection, which meant a mail a minute. Resolution now has to be earned twice over, and both knobs are on the Alert recovery card of Settings > Alert thresholds > Collection & recovery:
| Field | Default | Meaning |
|---|---|---|
| points below the warning threshold | 5 | How far under the warning level the value must come back, in points of that threshold's own unit. The field accepts 0 to 50, and 0 is read as the 5 point default rather than as "no margin" |
| consecutive checks below the margin | 3 | How many checks in a row must land under that margin before the alert is declared resolved. The field accepts 1 to 10, and 1 means "resolve on the first quiet check" |
A single check that comes back above the margin resets the counter to zero, so a value hovering just under its threshold keeps its alert active rather than flapping. With the metrics collection at its default of one minute, the default pair means three minutes of calm.
The margin is capped at half the warning threshold. Without that guard a low threshold, say a warning at 5%, combined with the 5 point default would leave no band at all to resolve in, and the alert would never clear.
Two situations skip the hysteresis entirely, because they cannot flap: a resource that has disappeared (a deleted snapshot, a destroyed OSD, a deleted replication job) and a check family that an operator has just switched off in the settings.
Setting the confirmations to 1 is what the screen offers to get close to the immediate resolution of earlier versions: the value still has to come back under the margin, but a single quiet check is enough. Dropping the margin itself to nothing is not reachable from this screen, since 0 is read as the default.
Recovery Notifications
When an alert is resolved, ProxCenter sends a Resolved: ... mail carrying, beyond the usual message and resource:
- Fired at -- when the alert was first seen
- Resolved at -- when it was declared over
- Duration -- how long it lasted, to the minute under a day and to the hour beyond
- The value it came back to, with its unit
This mail bypasses the minimum severity filter of Notifications. It has to: a recovery is a success, and a success ranks below any threshold an operator would set, so it would be dropped in silence otherwise. What still applies is the master switch: turning alert notifications off turns their recoveries off with them.
A recovery is only announced when the alert that ended had itself sent a mail. Event-rule alerts notify through their own rule rather than the generic alert mail, so they do not produce a recovery mail either, which avoids announcing the end of something nobody was told about.
A deleted snapshot never comes back through the checker, so its alert used to stay active for ever and its firing mail never had a counterpart. The snapshot check now sweeps the alerts it did not re-raise and resolves them, but only when it managed to inspect the whole inventory: a Proxmox API error must not be mistaken for "the snapshot is gone". The same sweep protects Ceph OSD and replication alerts.
Severity in the Mail
An alert mail now carries the severity the engine established against the warning and critical levels, the same one shown in the interface. It used to be re-derived in the notifier from the value against the threshold, which said nothing useful about an alert with no measured quantity: a failed replication job, for instance, was always classed as a warning and so never reached an operator whose minimum severity is set to critical.
Tenant Scope
Alerts are scoped consistently with inventory visibility:
- Tenant users see alerts only for their own vDC resources.
- Provider administrators can filter and resolve alerts across tenants.
- Shared-node clusters do not leak alerts from one tenant to another.
- Event-based alert rules only surface matching events visible to the current tenant.
Orchestrator Connection
Alerts require the ProxCenter orchestrator service to be running. If the orchestrator is unavailable, a warning banner will appear at the top of the page. The orchestrator handles:
- Periodic resource monitoring across all connected nodes
- Event stream analysis against configured rules
- Alert creation, deduplication, and lifecycle management