Availability and SLA
Operations > Availability and SLA measures the uptime of your Proxmox nodes and clusters, follows SLA targets over groups of guests, and takes declared maintenance out of the figures. An incident register groups the alerts of an outage, with a journal, corrective actions and a post-mortem that exports as a PDF.
Both are Enterprise features. The provider sees every measured connection; a tenant that owns whole connections sees those, and a vDC tenant does not see the page.
Quick Path
Before you start
- An Enterprise license that includes availability monitoring.
- At least one Proxmox VE connection.
Start measuring
- Open Operations > Availability and SLA and click the settings icon at the top right.
- Tick the connections to measure and save, see Measured connections.
- Create an SLA policy in the Policies tab, see SLA policies.
- Declare planned work in the Maintenance tab before it starts, see Maintenance windows.
Check the result
- The Overview tab draws a timeline per connection, filling from the moment the connection was ticked.
- The Policies tab shows each policy against its target.
Measured connections
Nothing is measured until an administrator ticks connections. The orchestrator then records, for every ticked connection, the state of its nodes, the quorum of its cluster and the state of its guests.
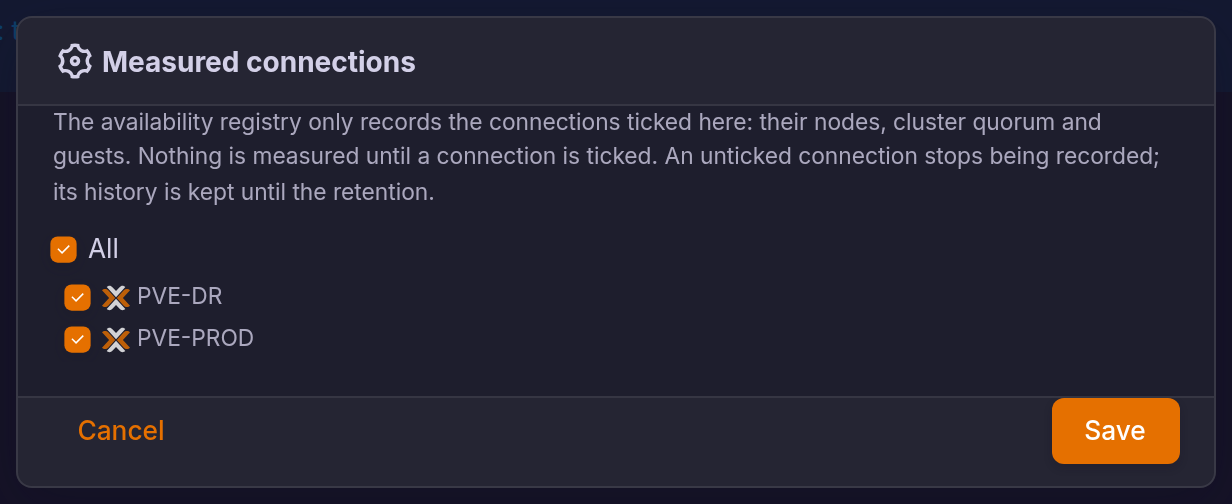
Unticking a connection stops its recording; its history is kept until the retention removes it. The dialog names the SLA policies that still cover guests of a connection before you untick it.
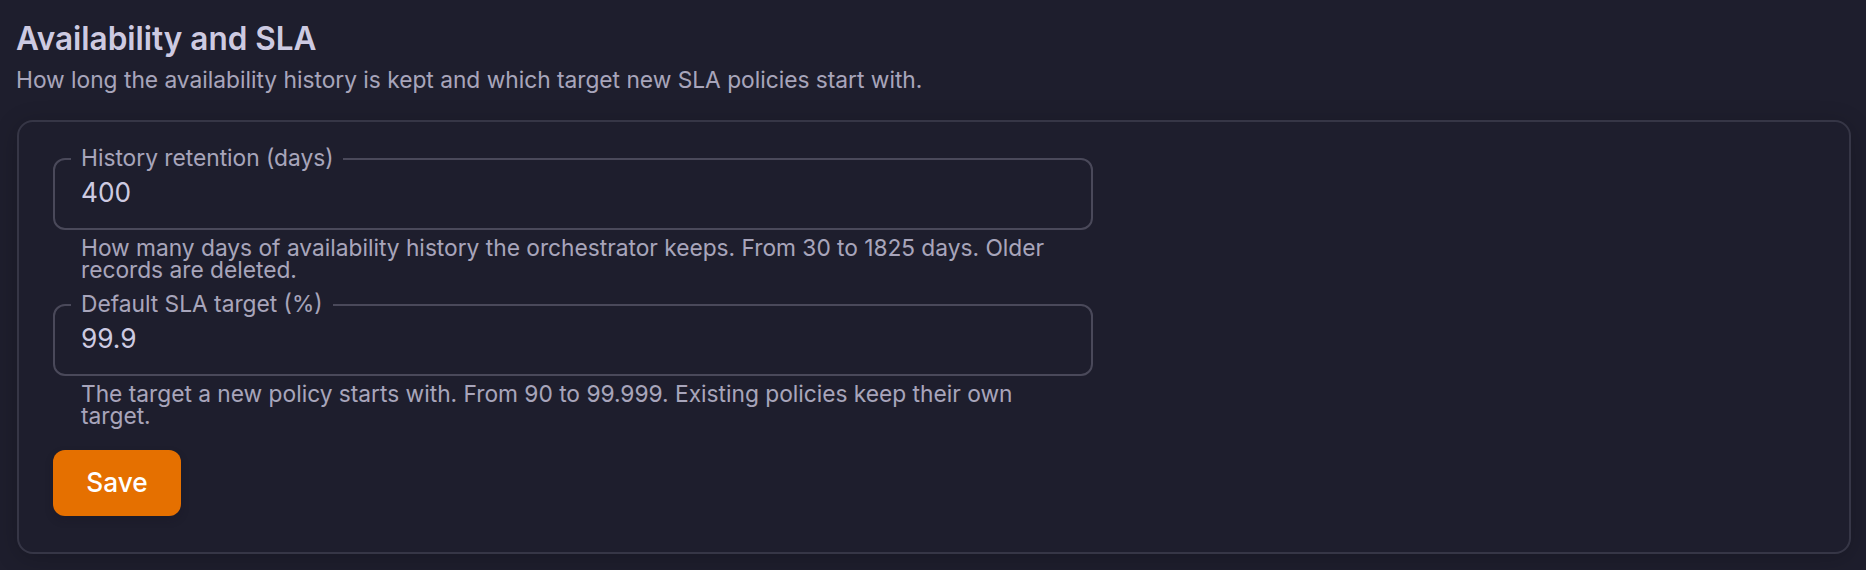
The history is kept 400 days by default, and new policies start with a 99.9 % target. Both are set in Settings > Availability and SLA: the retention from 30 to 1825 days, the default target from 90 to 99.999 %.
Overview
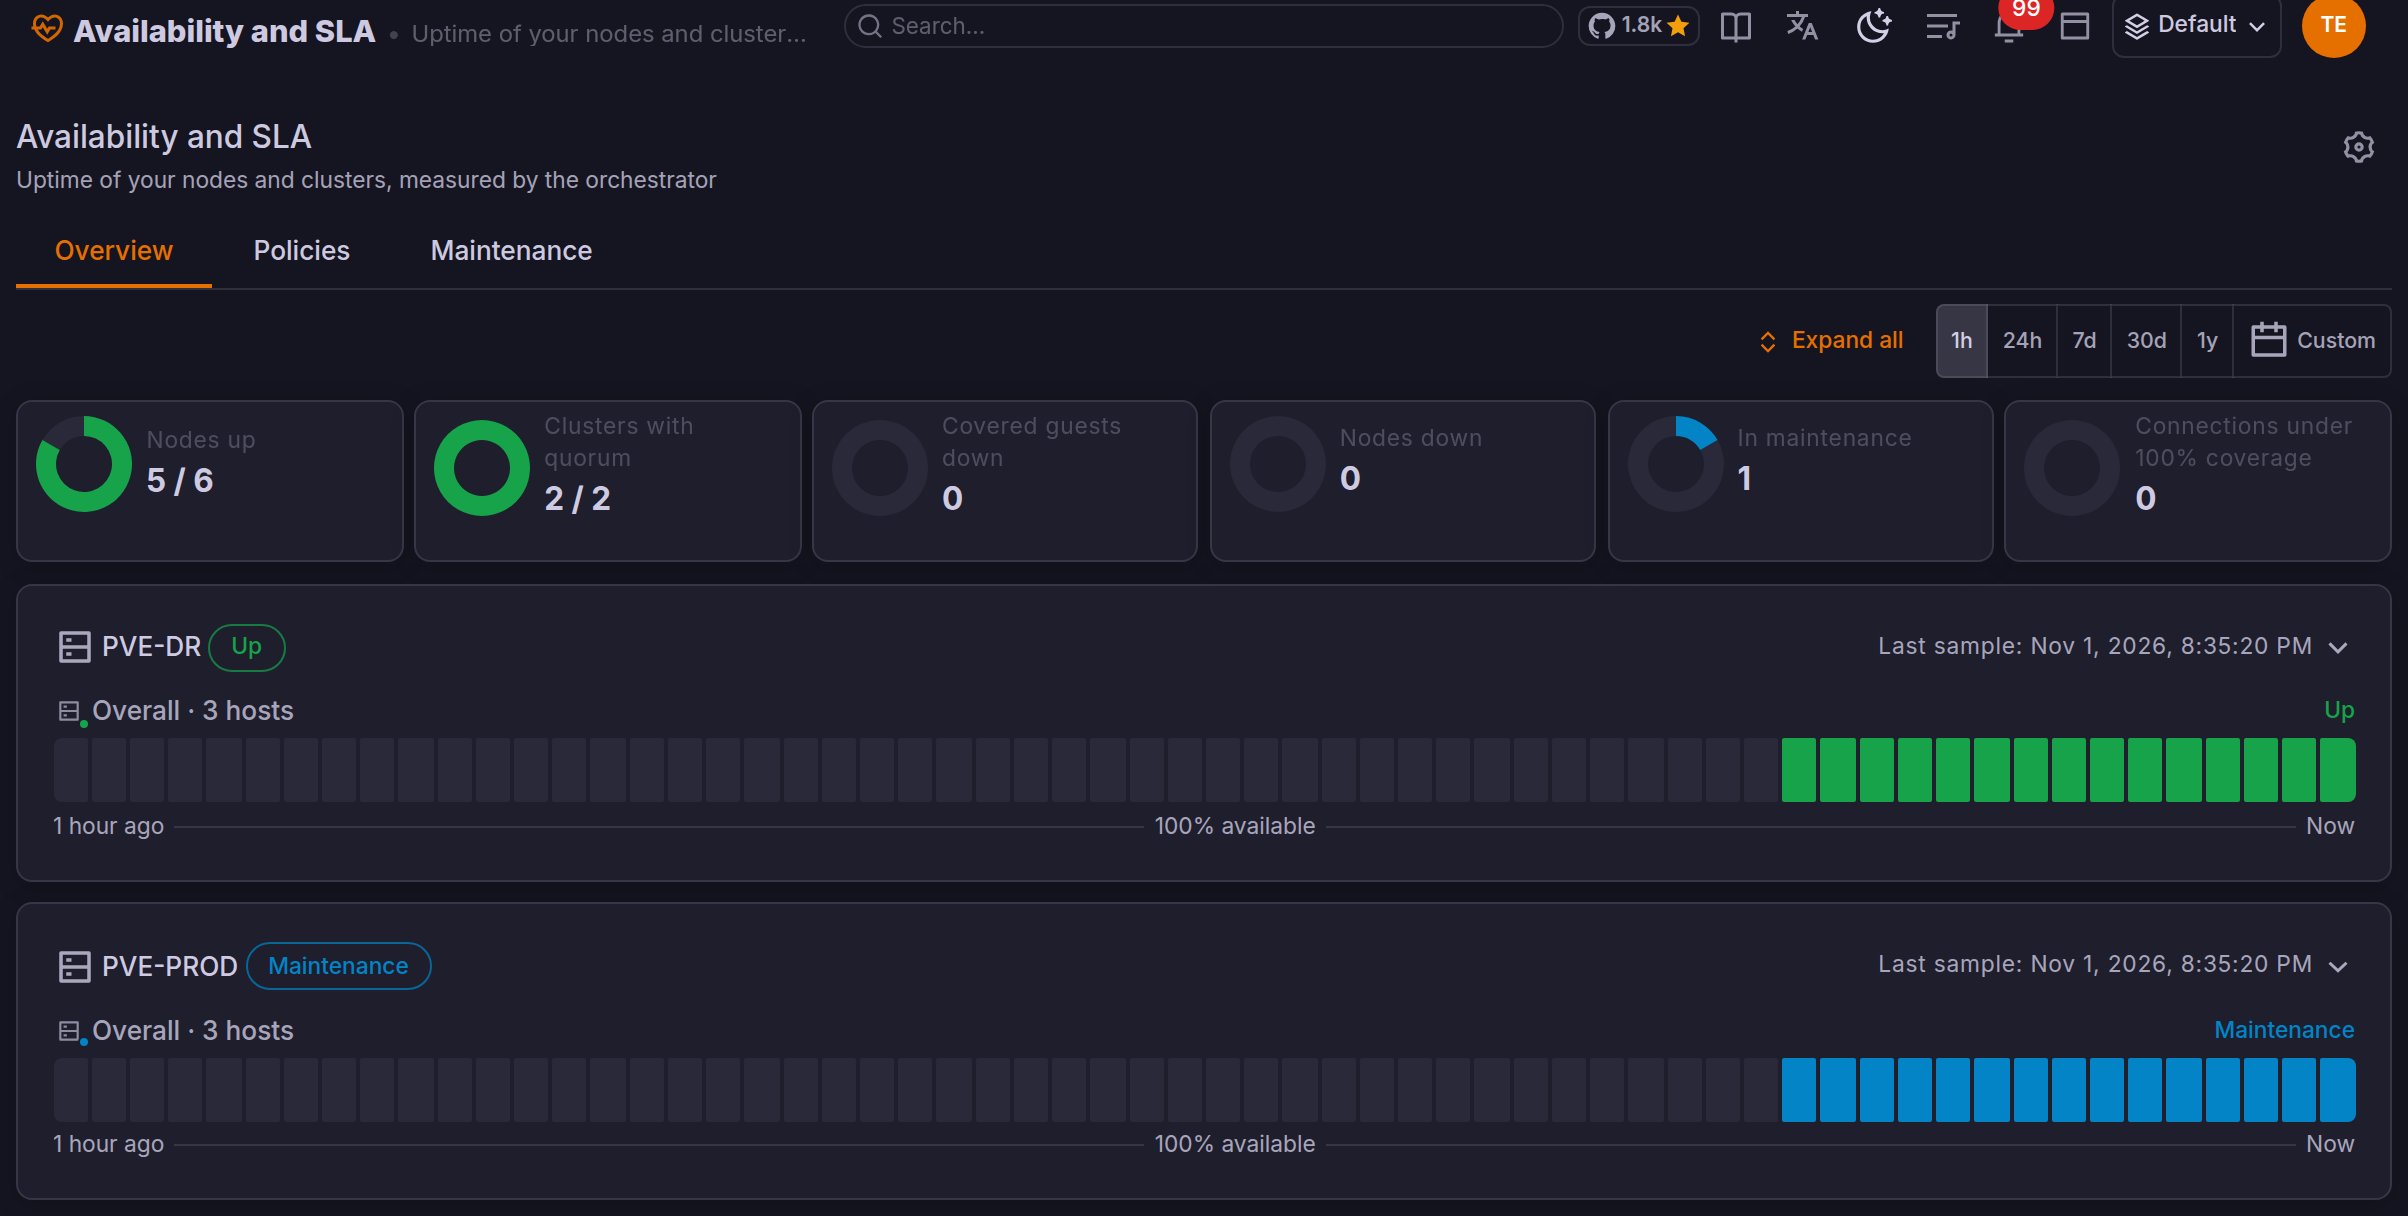
The tiles count the nodes up, the clusters with quorum, the covered guests down, the nodes down or in maintenance, and the connections whose coverage is below 100 %. Pick the period at the top right: the last hour, 24 hours, 7 or 30 days, a year, or a custom range.
Each connection shows one summary timeline, drawn as status-page bars. Expand all, or the arrow of a connection, unfolds its rates and one timeline per host.
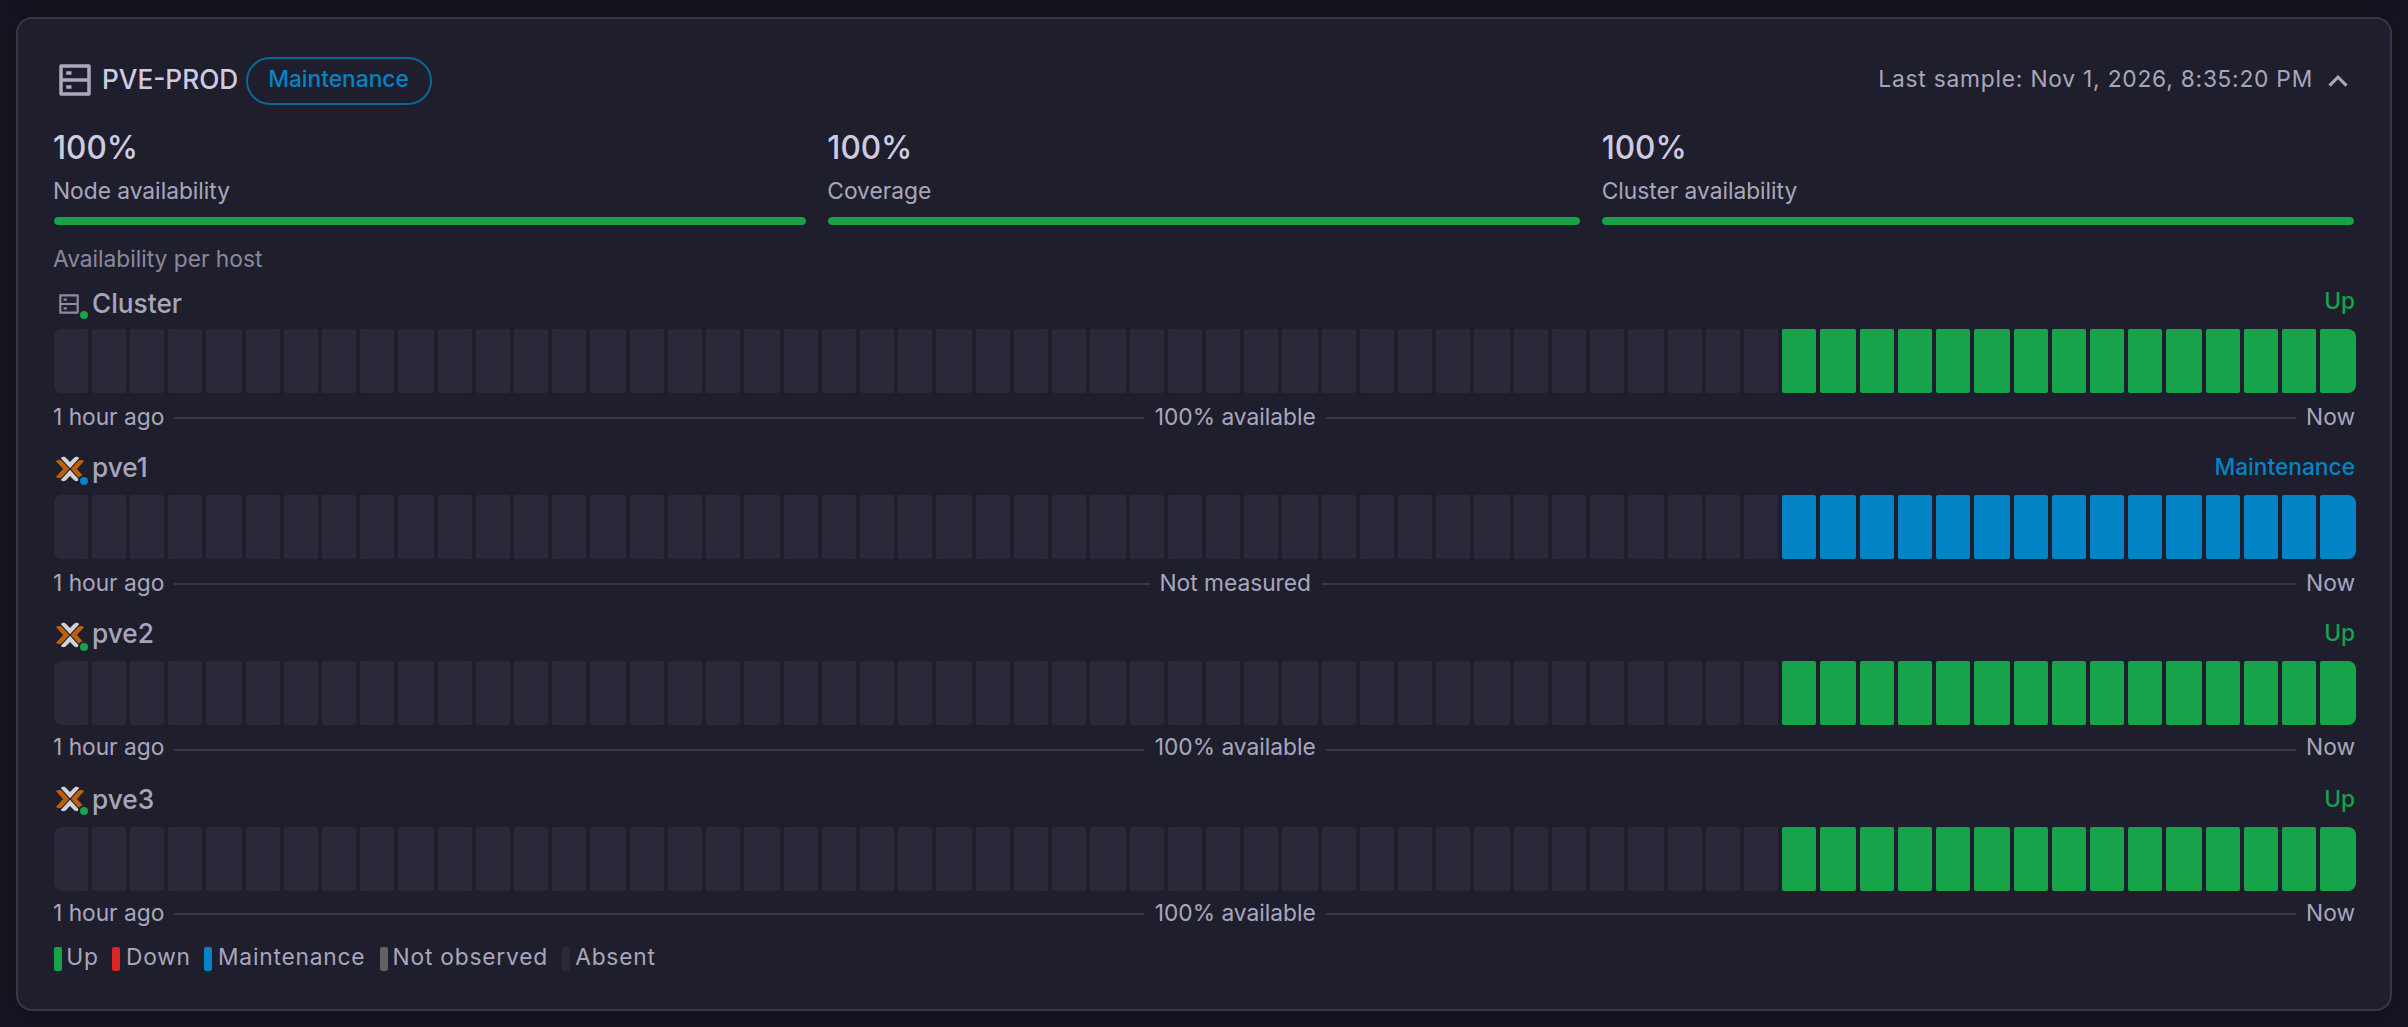
| State | Meaning |
|---|---|
| Up | The object answered and was healthy. |
| Down | The object was observed down. |
| Maintenance | The node was in maintenance mode, or inside a declared maintenance window. |
| Not observed | The registry could not see the object, for instance while the orchestrator was stopped. |
| Absent | The object did not exist yet, or was not measured at that time. |
How the rates are calculated:
- Availability = up time / (up time + down time).
- Coverage = (up time + down time) / (up time + down time + not observed time). It tells how much of the period the registry actually saw.
- Maintenance and absent periods are left out of both rates.
- A rate is shown as not measured when nothing was observed, never as 0 %.
Click an outage on a timeline to open the incident that holds it, or to create one from the matching alert.
SLA policies
A policy sets an availability target for a group of guests, measured over the last 30 days.
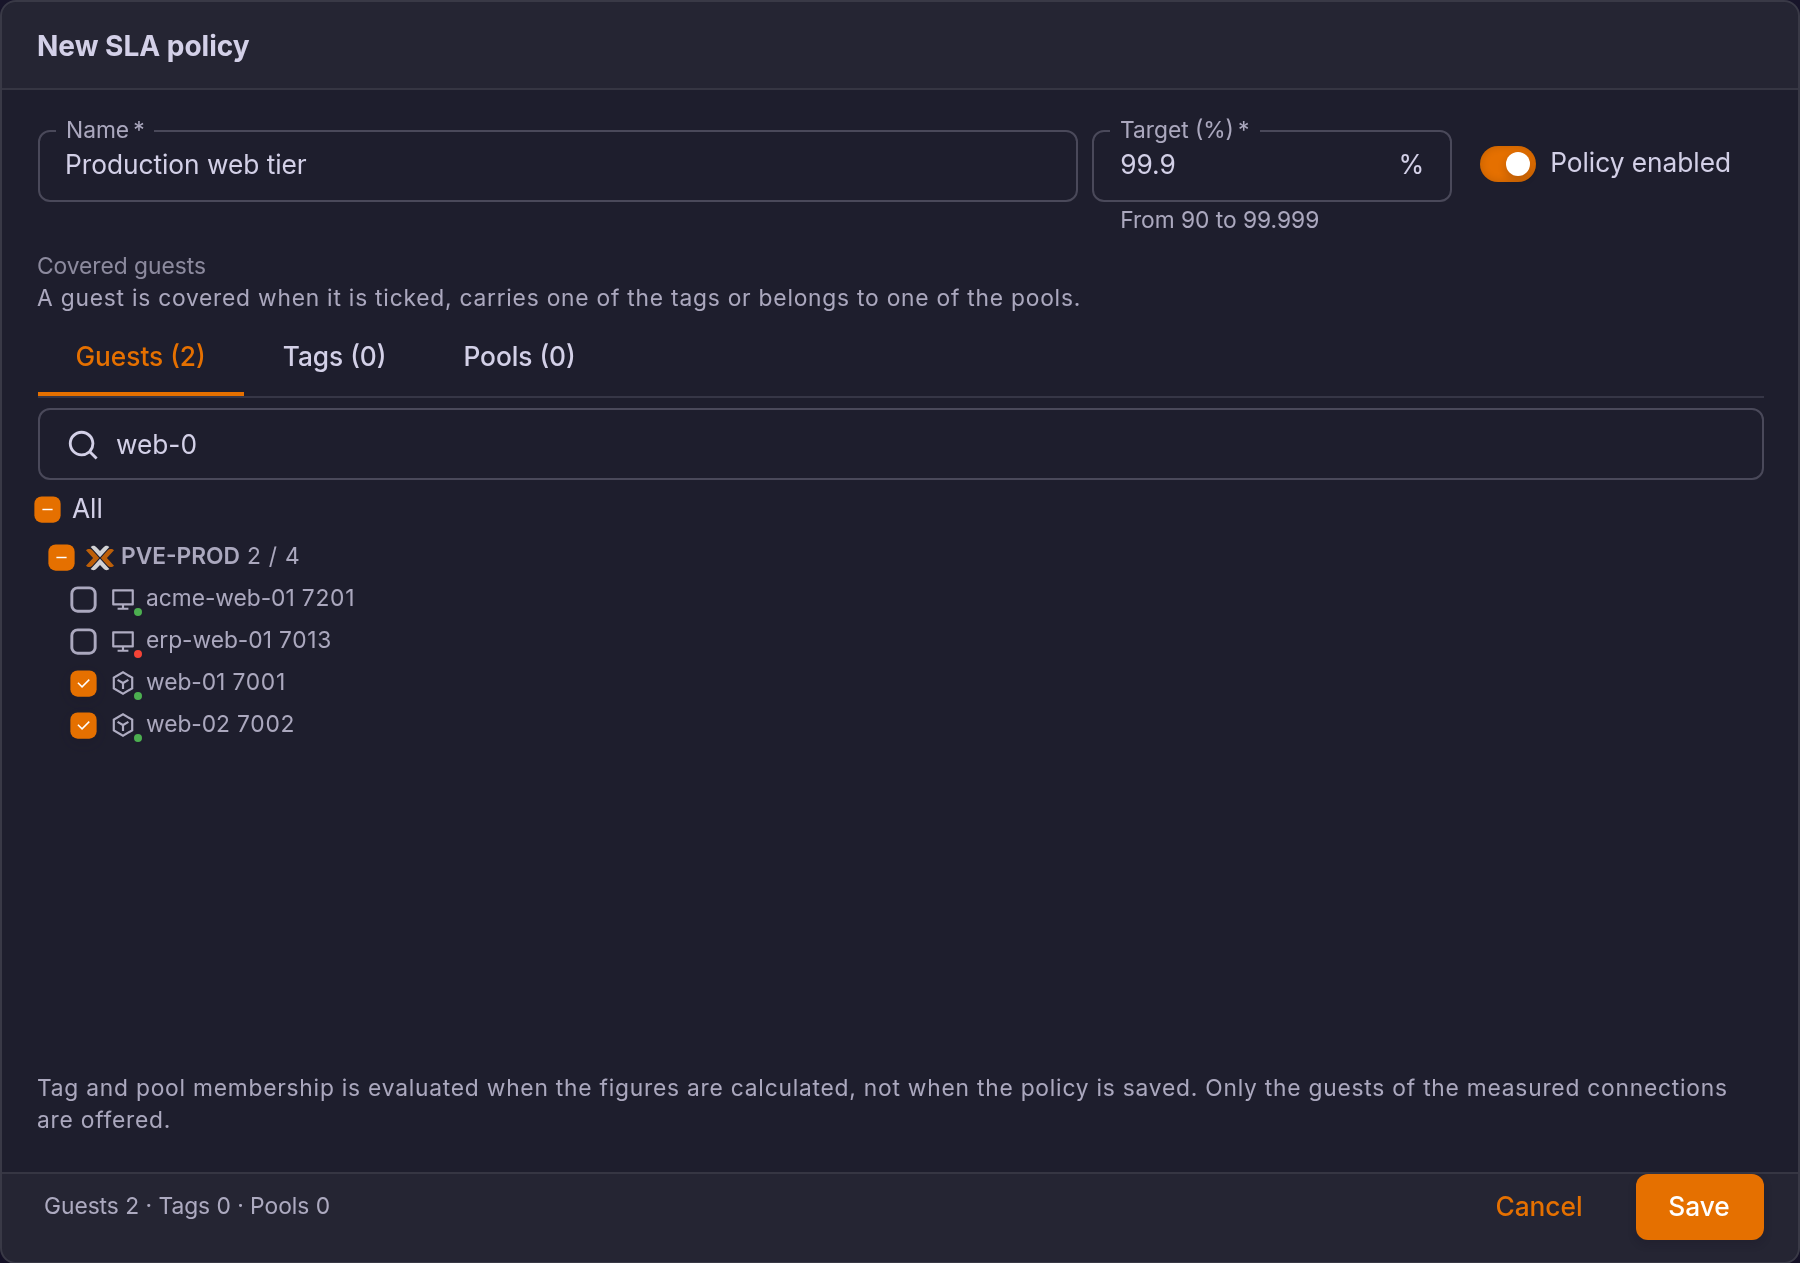
| Field | Description |
|---|---|
| Name | Unique within the tenant. |
| Target (%) | From 90 to 99.999. |
| Policy enabled | A disabled policy keeps its definition but is not evaluated. |
| Covered guests | A guest is covered when it is ticked, carries one of the tags, or belongs to one of the pools. Tag and pool membership is evaluated when the figures are calculated, not when the policy is saved. |
Only the guests of measured connections are offered. A policy refuses a newly ticked guest on an unmeasured connection, keeps the guests it already holds, and shows how many of them are not measured.

The downtime budget is the downtime the target allows over the period, and the bar shows how much of it is used. Open a row to list the guests below target.
Budget notifications
SLA is a notification category: it sends a warning once a policy has spent the chosen share of its downtime budget, then a critical notification once the target is lost for the period. Set the Budget period (calendar month or last 30 days, rolling) and the Warning threshold, and subscribe channels, in Notifications. Covered guests going down and a lost cluster quorum come through the Alerts category.
SLA report
The SLA report type of Reports exports the policies, their availability and the outages, in PDF or CSV, on demand or on a schedule.
Maintenance windows
During a declared window, the downtime of the targeted objects counts as maintenance, not as an outage. Declare a window before planned work so that it does not count against the targets.
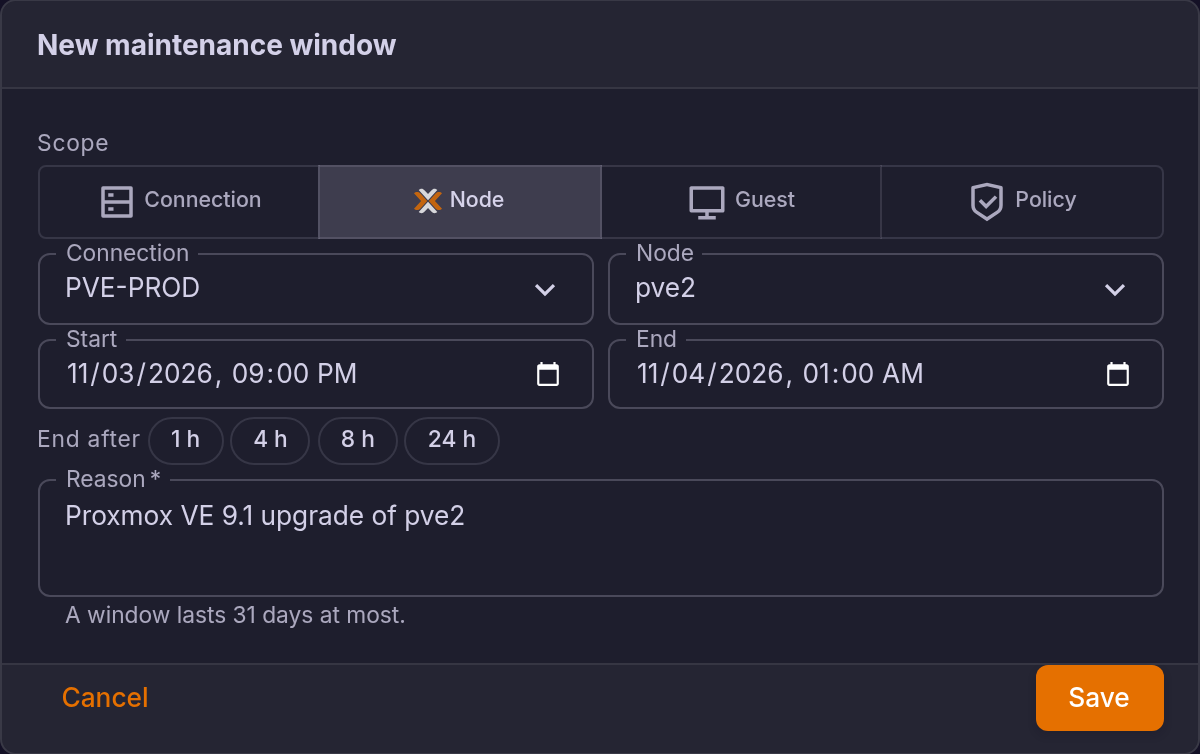
| Field | Description |
|---|---|
| Scope | A whole connection, a node, a guest, or the guests of a policy. |
| Start / End | A window lasts 31 days at most. End after sets the end 1, 4, 8 or 24 hours after the start. |
| Reason | Required, shown in the list and in the SLA report. |

A node put in maintenance mode from ProxCenter, for a rolling update for instance, is counted as maintenance even without a declared window.
Incident register
An incident groups the alerts of one outage. Open one from an alert, with the incident button of its row in Alerts, or from an outage of a timeline. The Incidents tab of the Alerts page lists them, filtered as open, resolved or closed, and the alert list gains an Incident column.
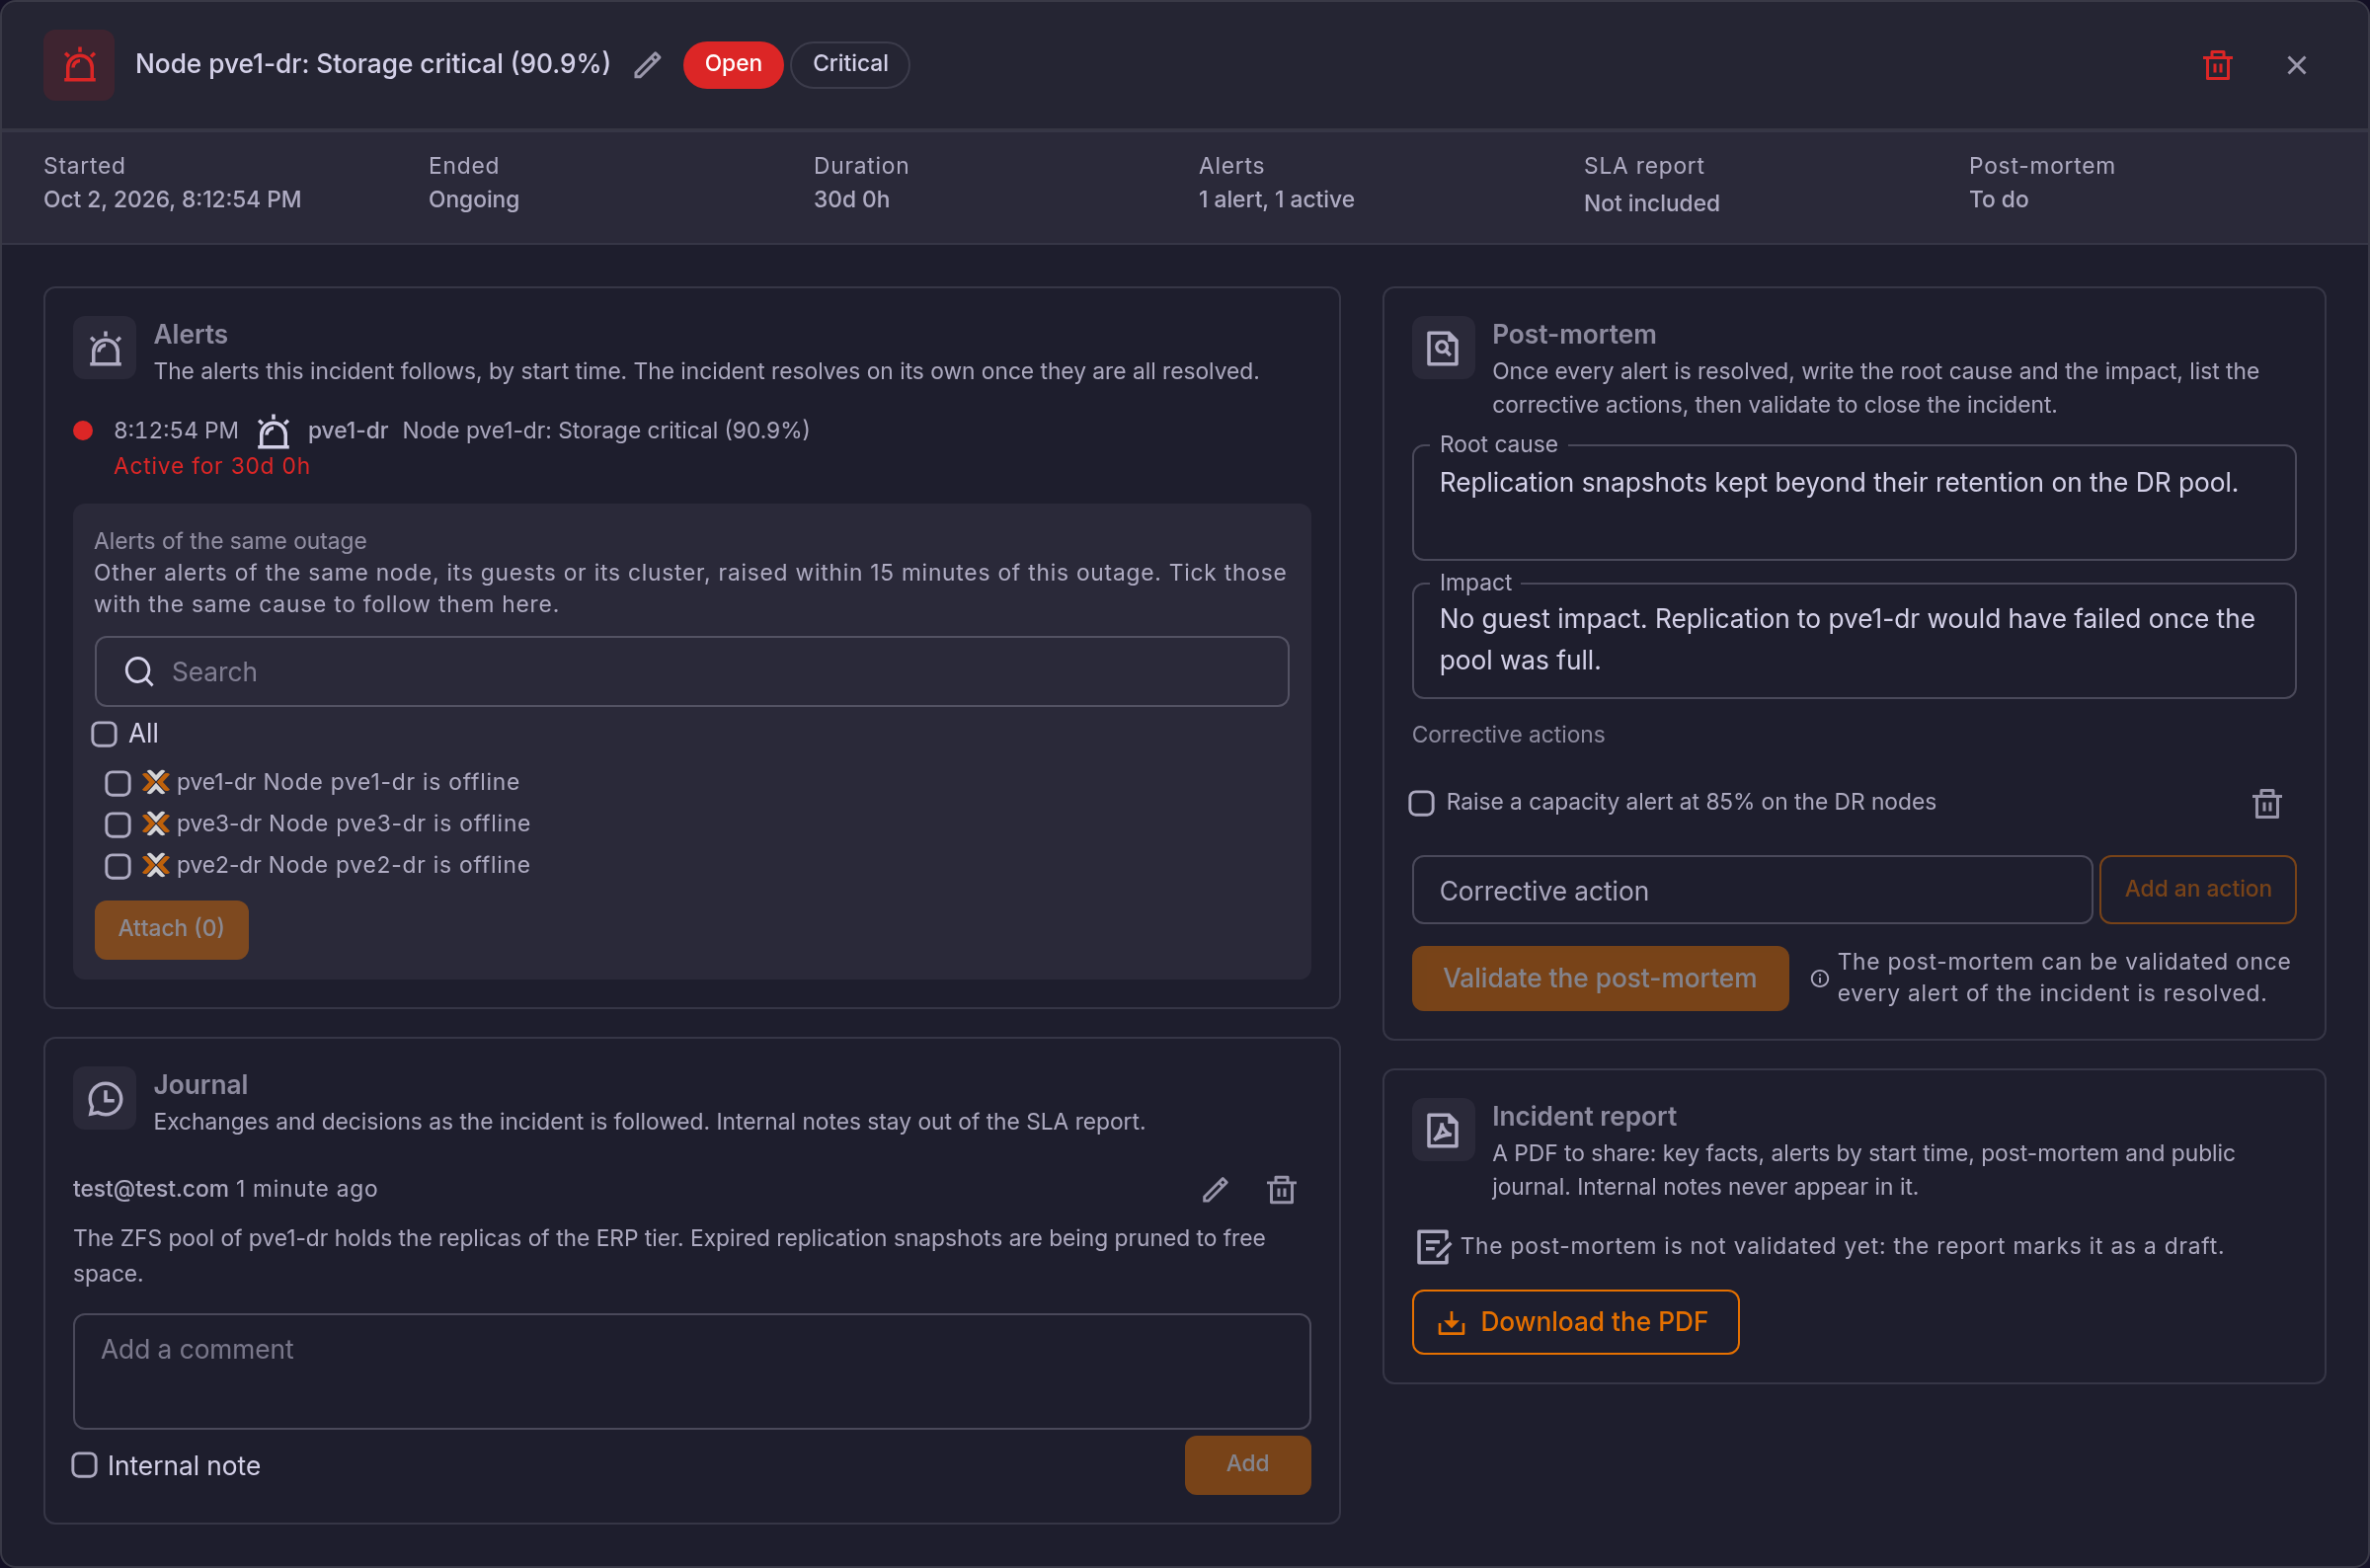
- Alerts. The incident follows its alerts by start time. Alerts of the same outage proposes the other alerts of the same node, its guests or its cluster raised within 15 minutes: tick those with the same cause and attach them.
- Journal. Comments record the exchanges and decisions as the incident is followed. An internal note stays out of the SLA report and of the PDF.
- Lifecycle. The incident resolves on its own once every alert is resolved. It closes only when the post-mortem is validated, with a root cause and an impact.
- Post-mortem. Write the root cause and the impact, list the corrective actions and tick them as they are done, then Validate the post-mortem.
- Incident report. Download the PDF exports the key facts, the alerts, the post-mortem and the public journal. Until the post-mortem is validated, the report is marked as a draft.
An alert held by an incident cannot be deleted. A batch delete of alerts says how many were kept for that reason.
The register belongs to the provider tenant, and every view is narrowed to the alerts the user may see.