Ceph Monitoring
The Ceph page provides dedicated monitoring for Proxmox nodes running a Ceph storage cluster. Get a consolidated view of cluster health, OSD status, pool configuration, and performance metrics without leaving ProxCenter.
This page is only relevant if one or more of your connected Proxmox nodes are part of a Ceph cluster. If no Ceph configuration is detected, the page will indicate that no Ceph cluster is available.
Cluster Health Overview
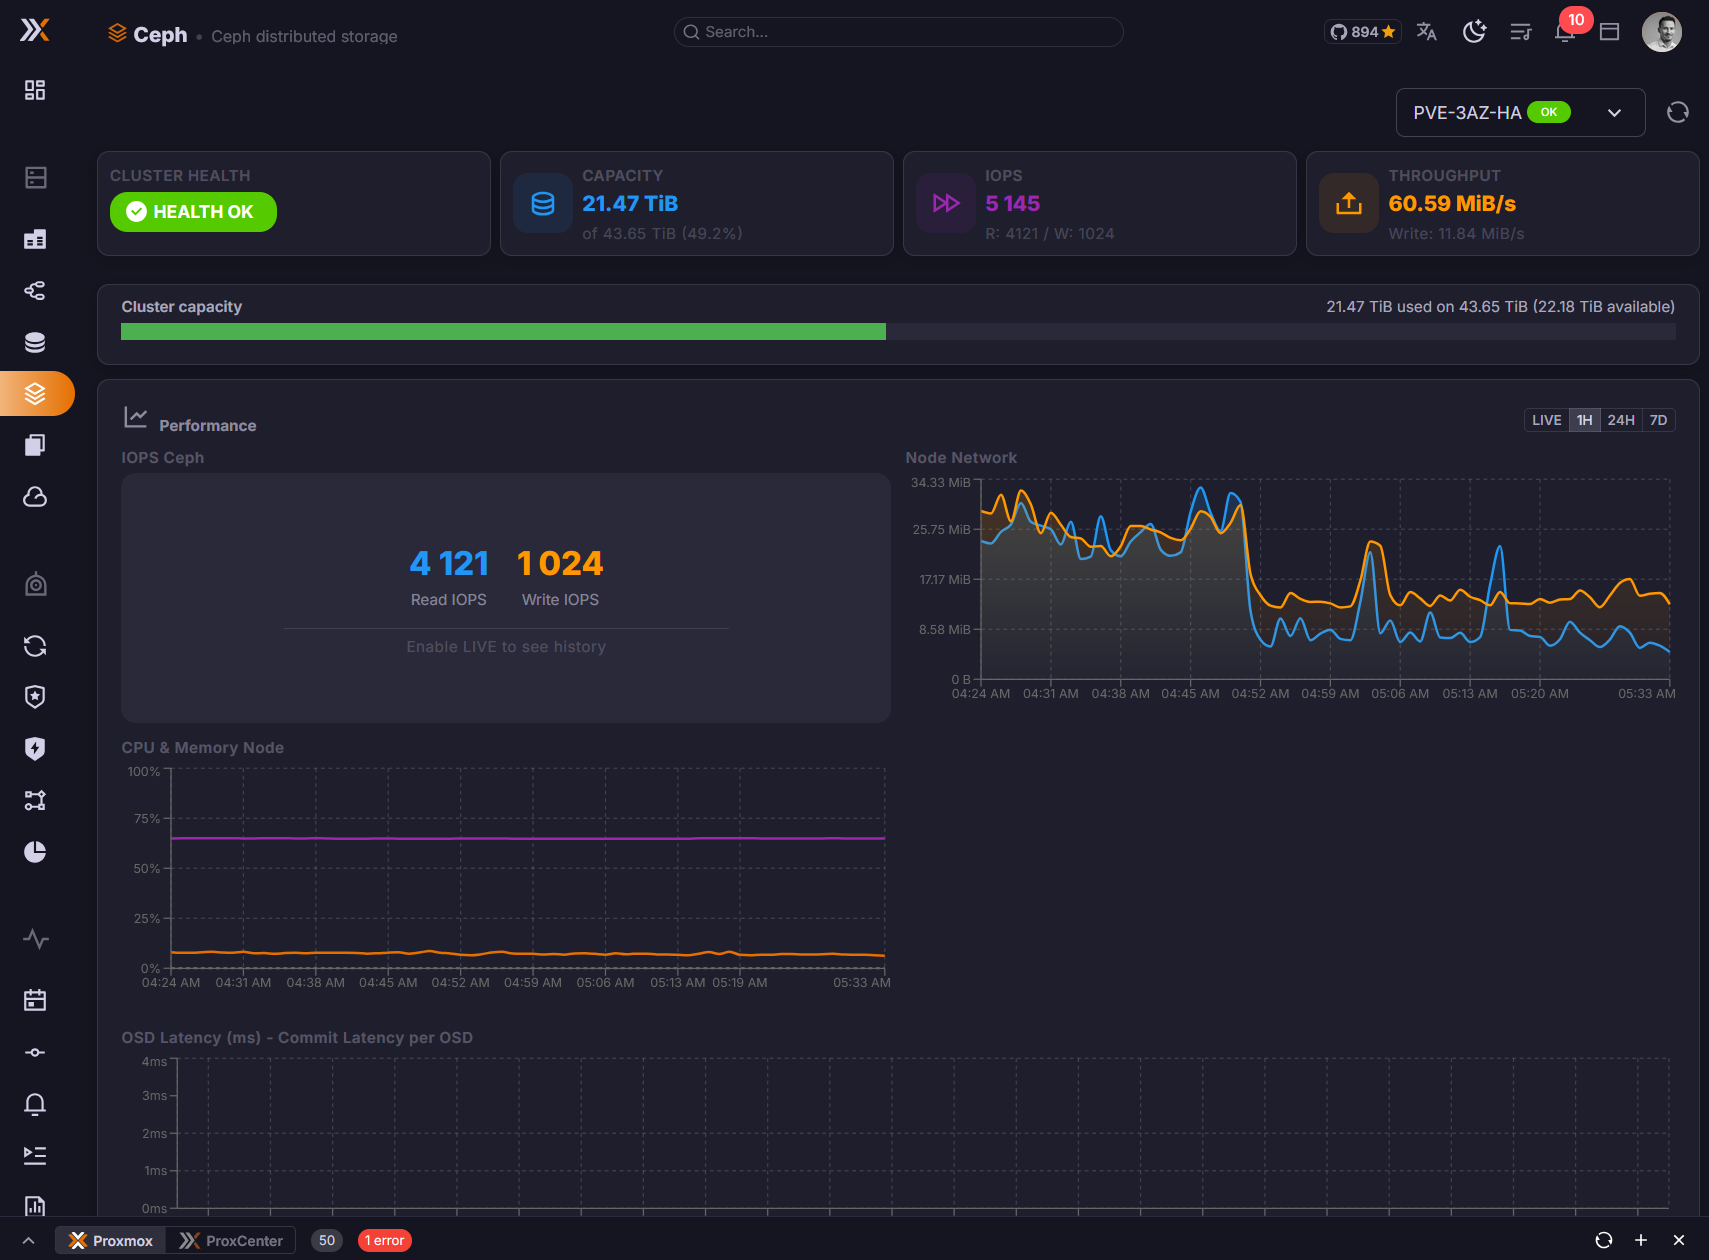
The top of the page displays the overall health status of your Ceph cluster:
- Health status —
HEALTH_OK,HEALTH_WARN, orHEALTH_ERRwith a color-coded indicator - Health messages — Any active warnings or error messages reported by the Ceph monitor
- Monitor quorum — List of Ceph monitors and their quorum status
- Cluster capacity — Total raw storage, used space, and available space across all OSDs
A HEALTH_WARN status does not always indicate a critical problem. Common warnings include near-full OSDs, degraded placement groups recovering after a node restart, or clock skew between monitors. Review the health messages for details.
OSD Status
The OSD (Object Storage Daemon) section lists all OSDs across your Ceph cluster with their current state:
| Field | Description |
|---|---|
| OSD ID | Unique identifier of the OSD |
| Node | The Proxmox host where the OSD is running |
| Status | up / down — whether the OSD daemon is running |
| State | in / out — whether the OSD is participating in data placement |
| Used | Space consumed on this OSD |
| Total | Total capacity of the OSD |
| Usage % | Percentage of capacity used |
| Class | Device class (HDD, SSD, NVMe) |
OSDs that are down or out are highlighted so you can quickly identify storage devices that need attention.
Pool Information
The Pools section shows all Ceph pools configured in your cluster:
- Pool name — The identifier of the pool
- Size / Min Size — Replication factor and minimum number of replicas required for I/O
- Placement Groups (PGs) — Number of placement groups assigned to the pool
- Usage — Data stored, total capacity allocated, and usage percentage
- CRUSH Rule — The CRUSH rule governing data placement for the pool
- Application — Which Ceph application the pool serves (RBD, CephFS, RGW)
Performance Metrics
The performance section provides real-time insight into Ceph cluster throughput and responsiveness:
- IOPS — Read and write operations per second across the cluster
- Throughput — Read and write bandwidth (MB/s)
- Latency — Average commit and apply latency for OSD operations
- Recovery — If the cluster is recovering or rebalancing, the rate and estimated time remaining
These metrics help you identify performance bottlenecks and verify that your Ceph cluster is operating within expected parameters.
Permissions
Access to the Ceph Monitoring page requires the following RBAC permission:
| Permission | Description |
|---|---|
storage.view | View Ceph cluster status, OSD information, pools, and performance metrics |
Users without this permission will not see the Ceph entry in the sidebar.